As microservices environments continue to grow in size and complexity, they create bigger challenges for DevOps teams working to monitor the health and behavior of their systems. New Relic recently announced the general availability of a new feature that addresses this challenge: anomaly detection for distributed tracing.
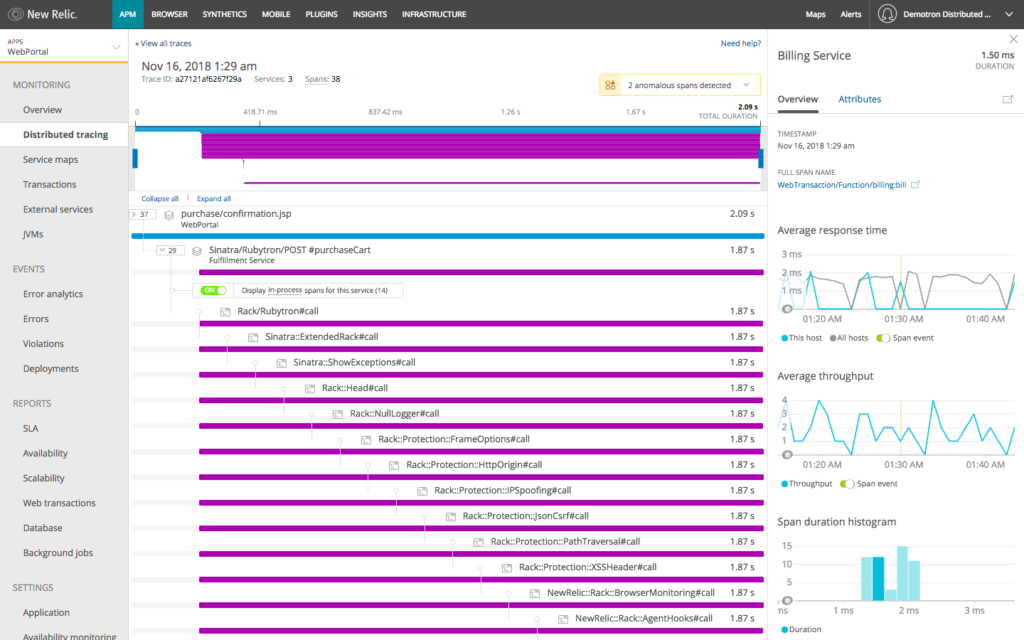
Anomaly detection automatically surfaces the anomalous parts of a trace, which allows customers to find and focus directly on sources of latency. It’s one in a series of New Relic releases devoted to distributed tracing improvements, including condensed trace views, deployment markers, and trace groupings—all of which help DevOps teams understand and troubleshoot microservices environments more quickly.
The challenges of using trace data to resolve performance bottlenecks
Distributed tracing helps you understand how requests flow through your microservices environment. This capability makes distributed tracing useful for finding sources of latency and errors within these environments. By tracing a request as it goes from one service to another, and timing the duration of important operations within each service, you get a complete picture of any performance issues or bottlenecks that impact the request within a distributed system.
However, digging through all of this trace data to find actionable insights can be time-consuming—requiring you to filter down to relevant traces that will actually help you spot the problem. As distributed systems continue to scale and get more complex, this process of finding the relevant traces and spans required to solve a performance problem will just keep getting harder.
In addition, even after you find a relevant trace, it’s often difficult to understand the flow of the trace—and it can be impossible to tell whether a specific span within the trace was performing normally. To make matters worse, many distributed tracing solutions provide only high-level, service-to-service details. These solutions fail to drill down into the details that indicate what’s actually happening inside the service—yet these highly specific, in-process details are precisely what a developer needs to see when the source of a performance problem lies within the service itself.
Highlighting performance bottlenecks with applied intelligence
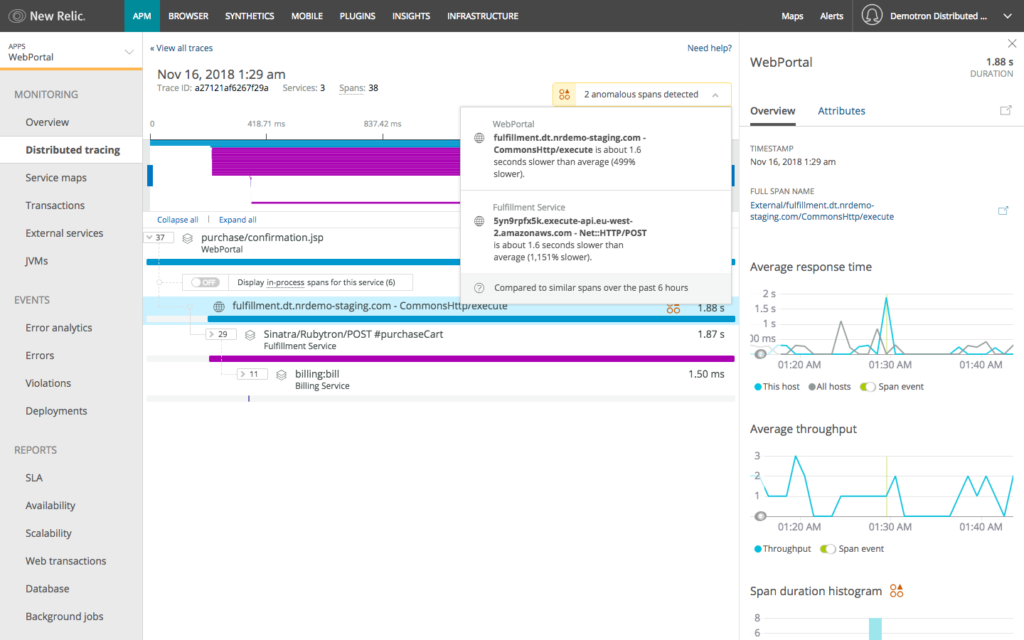
New Relic has introduced anomaly detection to automatically highlight unusually slow spans within a trace, making it easier for you to find and focus on these anomalous sources of latency. New Relic Applied Intelligence—a set of services that includes artificial intelligence, machine learning, and advanced statistical analysis—plays a key role in this capability by making connections and uncovering actionable insights within even the biggest anomaly detection data sets.
When New Relic views a trace, it uses anomaly detection to compare the spans within that trace to the spans of other, similar traces. It then highlights spans with longer-than-normal latency times based upon this comparative analysis. For each anomalous span, New Relic displays a summary that shows why it flagged the span as anomalous. New Relic also creates histogram charts showing the duration distribution of similar spans; these also show how the anomalous span compares to its peers over the past six hours. The latter capability is particularly useful for understanding how much of an outlier a particular span represents.
These capabilities also help teams in microservices environments where they often look at traces that involve their own services, but they may also look at traces involving services that they don’t own and don’t understand deeply. For these teams, it’s often difficult to understand what’s “normal” in a trace. With New Relic’s anomaly detection, these teams now get a fast and highly accurate sense of what’s normal in a given situation versus what’s unusual and needs attention.
Faster root-cause identification with improved trace navigation and context
We’ve also released a number of improvements that make it easier to to pinpoint underlying problems using trace data.
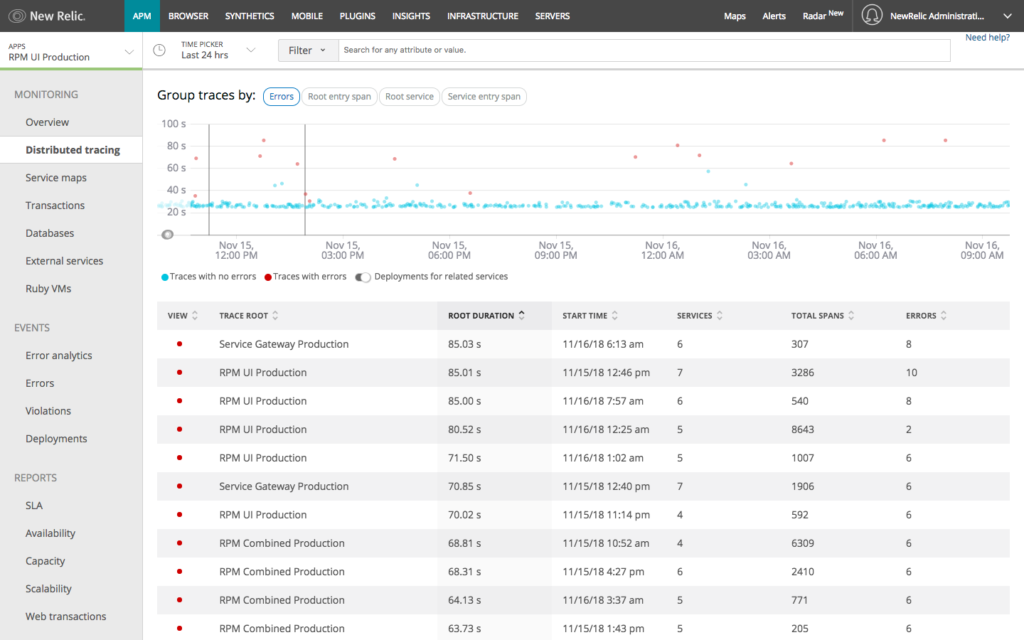
Trace groupings: Reproducing issues often requires identifying patterns: Are traces that originate from a specific service slower than others? Is a specific entry span slower or faster than others? Are errors clustered during a specific time period? Trace grouping allows you to organize traces by errors, root service, root entry span, and service entry span giving you more ways to zero in on traces that are relevant to the problem you’re trying to solve.
Deployment markers: Deployments and other changes often cause performance problems. In these cases, correlating a difference in trace behavior with a particular deployment to an upstream or downstream service lets you identify the offending service more quickly. Embedded deployment markers provide this context as part of the trace scatter plot—making the process of identifying potential impacts from upstream and downstream changes much more straightforward.
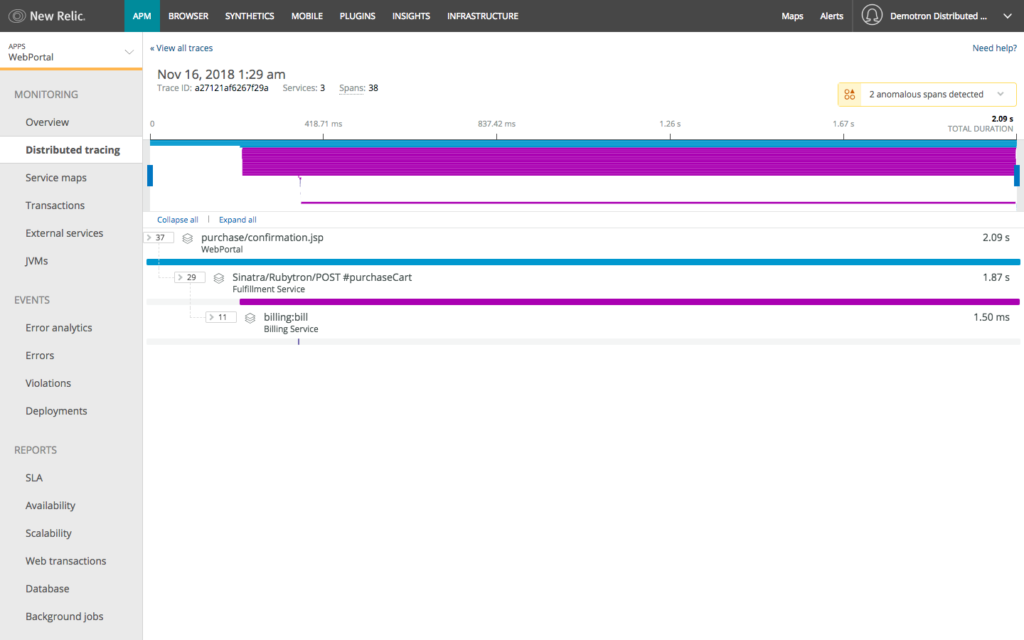
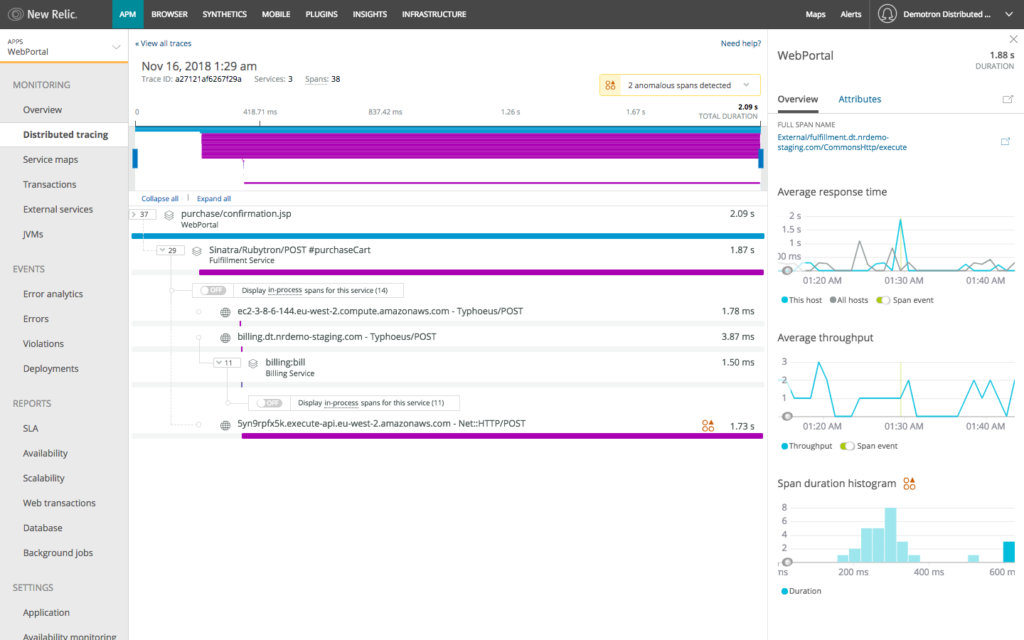
Condensed trace views: Complex microservice environments require monitoring that delivers the best of both worlds: the simplicity and clarity of a high-level system overview but also letting users drill deeply into specific transactions and processes to troubleshoot them. Our updated and condensed trace view satisfies both of these requirements. It begins with a high-level view that makes it easy to understand the flow of a given request. From there, however, you can expand different spans to see the detail within a specific service; and you can drill into in-process operations that show exactly how much time was required within the service for tasks such as internal method calls and functions. Going deep into these in-process spans can make it easier to spot potential sources of latency and errors, such as servlet filters in Java applications.
Customize dashboards and target alerts to specific services and spans
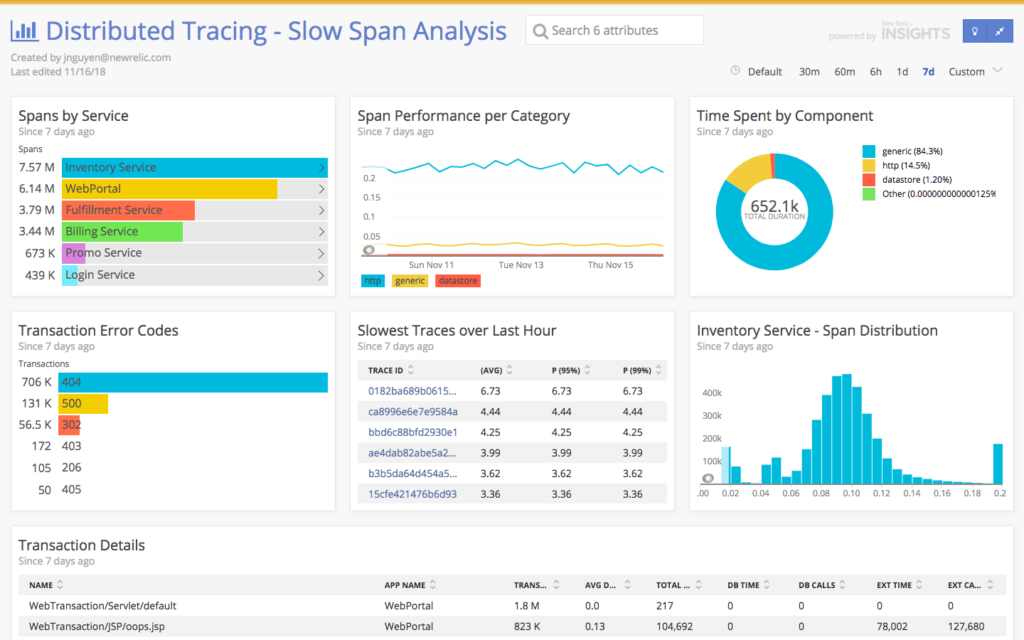
New Relic customers get a curated, out-of-the-box distributed tracing experience automatically when they implement a New Relic APM language agent. At the same time, the underlying trace data is also available in New Relic Insights—where all span and transaction events are available for custom dashboarding. Users can create Insights dashboards, using powerful NRQL queries, that are fully customized for their own teams and systems. These queries also give users the option to create targeted NRQL alerts that notify teams instantly about errors or performances issues in their services.
A look at troubleshooting issues in complex environments
During our early-access testing of these new features, we found teams digging up interesting issues in their environments. One customer, for example, identified a periodic rebuild within one of their distributed cache services—an incredibly expensive issue that also caused significant slowdowns to requests during the rebuild periods. In this case, the customer quickly identified the issue by correlating the information they saw in traces during the slowdown periods.
We also found an interesting example involving a trace on an unfamiliar system with a duration of 65 seconds—a duration that appeared to indicate abnormally slow performance. Normally, we might have assumed that the trace was, indeed, anomalous and we were surprised that anomaly detection was not flagging it. In reality, the trace involved a job that ran twice an hour and consistently required about 65 seconds—what turned out to be completely normal performance profile for the job that it was doing.
Since we also use New Relic to monitor our own production systems, we’ve been testing this release alongside our customers. One interesting issue that we uncovered involved a New Relic team member using anomaly detection to review slow spans in a set of traces. A pattern started to emerge—involving a set of requests that consistently had the same number of spans and duration. After grouping the traces by ‘Service entry span,’ the team member found that the requests always called the same API and always encountered the same issue: a classic N+1 query problem associated with an old version of our REST API.
In addition, since we have added custom attributes to these spans, we could see that these requests originated with a specific New Relic customer. We worked with the customer to adopt and integrate a newer, more performant version of the APIs. It was actually a great feeling to uncover such a pattern—one that otherwise might have remained hidden within the hundreds of microservices that we run, and one that allowed us to improve the New Relic experience for a customer!
Building better observability for distributed systems
Since our original release of distributed tracing, we have continued to build more useful and intuitive experiences for our customers working in microservices environments. Whether we provide better visibility into an organization’s service topology with Service Maps, or enable customers to drill deep into their services using our latest distributed tracing releases, or deliver innovation in any number of other ways, we continue to invest in making it easier for DevOps teams to find and resolve application performance issues.
To learn more about distributed tracing with New Relic, check out these resources in the New Relic documentation:
- Understand and use distributed trace UI
- Example Insights queries of distributed trace data
- Span event attributes
And if you haven’t enabled distributed tracing yet, do it today! We’ll show you how here.
Las opiniones expresadas en este blog son las del autor y no reflejan necesariamente las opiniones de New Relic. Todas las soluciones ofrecidas por el autor son específicas del entorno y no forman parte de las soluciones comerciales o el soporte ofrecido por New Relic. Únase a nosotros exclusivamente en Explorers Hub ( discus.newrelic.com ) para preguntas y asistencia relacionada con esta publicación de blog. Este blog puede contener enlaces a contenido de sitios de terceros. Al proporcionar dichos enlaces, New Relic no adopta, garantiza, aprueba ni respalda la información, las vistas o los productos disponibles en dichos sitios.


