Quickstart
Integration Features
Dashboards
Alerts
Documentation
dashboards
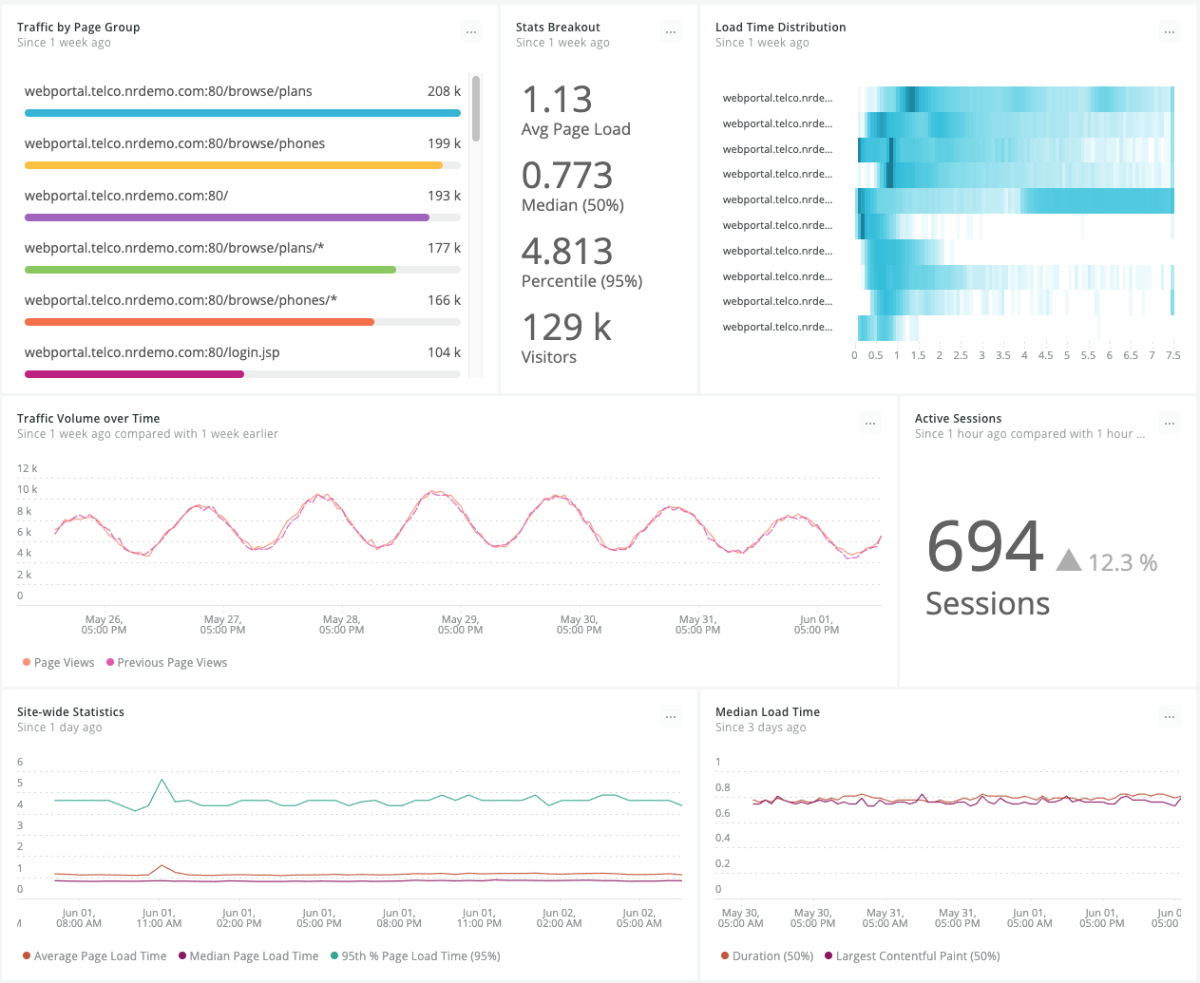
Browser examples quickstart contains 4 dashboards. These interactive visualizations let you easily explore your data, understand context, and resolve problems faster.
Show MoreShow Less
Browser Overview
See all
JavaScript Errors
See all
Browser Pages Dashboard
See all
Browser Traffic Analysis
See all
alerts
Browser examples observability quickstart contains 7 alerts. These alerts detect changes in key performance metrics. Integrate these alerts with your favorite tools (like Slack, PagerDuty, etc.) and New Relic will let you know when something needs your attention.
Show MoreShow Less
1. Pageload times (seconds)
This baseline alert condition evaluates pageload time deviations.
2. Largest Contentful Paint (75 percentile) (seconds)
This baseline alert condition evaluates LCP deviations.
3. Ajax Time to Settle Deviation
This baseline alert condition evaluates Ajax time to settle deviations.
4. First Input Delay (75 percentile) (ms)
This baseline alert condition evaluates FID deviations.
5. Ajax Response Codes (>= 300)
This baseline alert condition evaluates deviations in Ajax response codes over 299.
6. Throughput
This baseline alert condition evaluates throughput deviations.
7. Ajax Throughput
This baseline alert condition evaluates Ajax throughput deviations.
documentation
Browser examples observability quickstart contains 1 documentation reference. This is how you'll get your data into New Relic.
Show MoreShow Less

