Regardless of whether you're operating in the cloud or in a data center, right-sizing your workloads and finding optimization opportunities to control costs are constant tasks nowadays. Observability is essential for accomplishing these tasks, as it allows you to understand current costs, determine workloads with the highest opportunity for optimization, and conduct independent experiments to find new optimizations. Every business, workload, and piece of equipment is unique and may have different requirements based on their architectures or business needs. Therefore observability is essential.
In this post, we will examine some key strategies for finding opportunities to optimize your Kubernetes infrastructure with the goal of reducing your cloud bill.
Start with data, not opinions
At New Relic, we leverage our own observability platform to report cost information for various services and resources. We then provide this information to teams so that they can leverage the data, rather than opinions, to find optimization opportunities and reduce costs.
The majority of our services run on Kubernetes and so one of the key sources of monitoring used by teams to examine costs are the Kubernetes events. You can begin collecting these events easily by installing the Kubernetes Integration. This integration instruments the container orchestration layer and reports events with several metrics on each event. An useful example is the K8sHpaSample event which contains Kubernetes Horizontal Pod Autoscaler data. We have used this data internally to find and implement several cost optimizations.
We’ll go over a few of these optimizations which could help you reduce your cloud bill too:
- Right-sizing
- Autoscaling
- x86 vs ARM instances
- Spot Instances
Right-sizing
The era of virtual machines led to some teams utilizing oversized and underutilized resources. In these days of Kubernetes-based container computing, that problem has become even more prevalent. It is common for teams to set very high request resources, well above the actual demand of workloads, leading to the wastage of cloud instances that may be paid hourly and, therefore, result in higher costs.
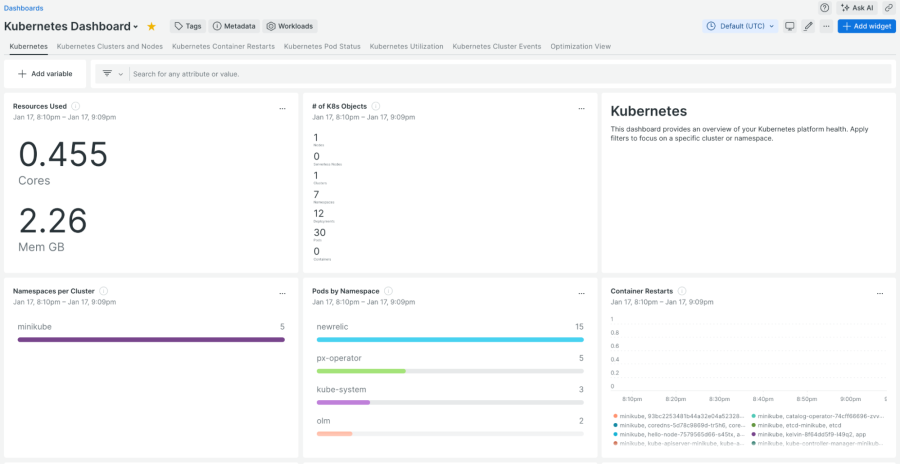
To more effectively utilize computing power and keep costs down, consider starting with our built-in Kubernetes dashboards and alerts, already included with the Kubernetes Integration. The next image shows an example of the dashboard included in this integration pack, offering a high-level view of a Kubernetes cluster.
As a first step, you should monitor the CPU and Memory usage for your pods and nodes by looking at the following metrics on the K8sContainerSample event, that includes these metrics:
- cpuUsedCores
- cpuRequestedCores
- cpuLimitCores
- memoryWorkingSetBytes
- memoryRequestedBytes
We will combine these metrics in NRQL queries, in order to check that your containers CPU and memory requests match what you actually need for your service to remain stable. If your service needs to burst above steady-state usage, consider setting a higher container CPU limit, while keeping the container request low. You can use this NRQL query to check how that CPU usage vs. CPU requested actually looks for a specific container:
Select average(cpuUsedCores)/max(cpuRequestedCores) from K8sContainerSample TIMESERIES FACET podname WHERE namespace = ‘your_namespace’ WHERE (containerName = ‘your_container’ AND clustername = ‘your_cluster’) limit max
If after conducting your experiments, you find out that a service has a significant usage variance, you could go ahead with the next step and determine whether autoscaling can ensure the most optimal resource allocation.
Autoscaling
Right-sizing should be the first step to controlling your compute expenses; however, it can be challenging depending on your company's scale and scenarios. Next step is to leverage the autoscaling capabilities available for Kubernetes. Autoscaling dynamically modifies the number of running pods based on observed resource utilization as well as the number of nodes in the cluster in order to ensure optimal performance and resource efficiency based on specified policies. We will be looking at three options::
- Horizontal Pod Autoscaling (HPA): gives the ability to dynamically adjust the number of pods in your service.
- Cluster Autoscaler: adjusts the number of worker nodes of the cluster, based on node utilization and pending pods.
- Karpenter: an open-source alternative to replace Cluster Autoscaler.
Our compute fleet runs mainly on Kubernetes clusters, which are structured on different node pools backed with specific instance types for different purposes. Some of them are owned by a specific internal team (due to the workload characteristics that run on them) and some are shared among several teams. In both cases, we’ve encouraged teams to do their own autoscaling experiments to choose the instance type that fits better according to their workload characteristics. When you run experiments, you should check how the HPA (Horizontal Pod Autoscaler) and the Cluster Austocaler (for adding more nodes to your node group) behave. Utilize this query along with the NRQL query from the resource usage section above, to monitor the number of work pods you have and assess HPA behavior:
SELECT max(podsAvailable) FROM K8sDeploymentSample FACET clusterName TIMESERIES LIMIT 100 WHERE (namespace = 'your_namespace') AND (deploymentName = 'your_deploymentName') SINCE 30 minutes AGO
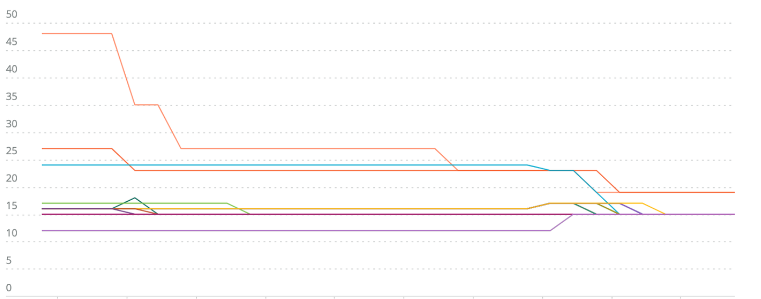
In the chart below, each line represents the number of pod instances in a specific cluster. Here we confirm the hypothesis that HPA would perform a right-sizing action and see it automatically decrease instances of our service:
Additionally, here is a NRQL query that uses InfrastructureEvent data to see how your cluster behaves when nodes are added or removed based on decisions made by the Cluster Autoscaler:
FROM InfrastructureEvent select uniqueCount(event.metadata.uid) where event.reason IN ('RegisteredNode', 'RemovingNode') facet event.reason TIMESERIES MAX since 1 day ago limit max
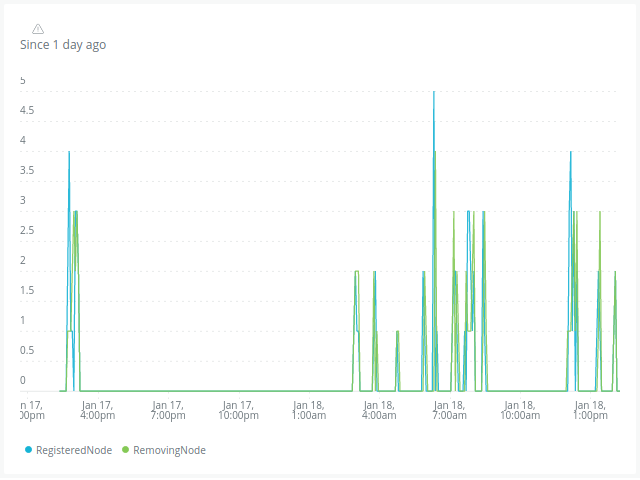
The combination of this observation with HPA actions will give you a good idea of the overall autoscaling decisions, and how quickly Cluster Autoscaler can respond to workload spikes.
Finally, although Cluster Autoscaler is a widely used tool, it has limitations regarding scheduling workloads and it does not resolve the bin packing problem in an efficient way. Using bin-packing, items of various sizes must be packed into a fixed number of bins or containers in a manner that minimizes wasted space. The goal is to find an efficient arrangement that uses the least number of bins possible.
Let’s introduce a different option for enabling cluster dynamic resizing with additional cost efficient features.
An alternative to Cluster Autoscaler: Karpenter
Cluster Autoscaler is the "de facto" standard for Kubernetes to dynamically resize the number of workers in each node pool of your cluster. The limitation of this is that you stay fixed to a specific instance type (and hardware characteristics), so the cluster-autoscaler algorithm can do its math right. However, imagine being able to evaluate the data every hour to identify the most advantageous cost-opportunity instance types, automatically react and consolidate workloads from different instance types? The open-source project Karpenter replaces Cluster Autoscaler and provides more opportunities for cost optimization. It observes the aggregate resource requests of unscheduled pods and makes decisions to launch and terminate nodes (starting pod eviction events) to minimize scheduling latencies and infrastructure costs. Moreover, it consolidates nodes whenever there is a more cost-effective allocation scenario, so it tackles the bin packing problem by deploying “tailored” instance types for your workloads.
For over a year, we have been utilizing Karpenter. In order to observe how Karpenter is performing when allocating workloads, we leverage metrics exposed by the K8sNodeSample event. To compare Node Pools, you can use this NRQL query and filter it (by using the WHERE clause) to include those you are interested in:
FROM K8sNodeSample SELECT (average(cpuRequestedCores) * cardinality(nodeName)) / (average(allocatableCpuCores) * cardinality(nodeName)
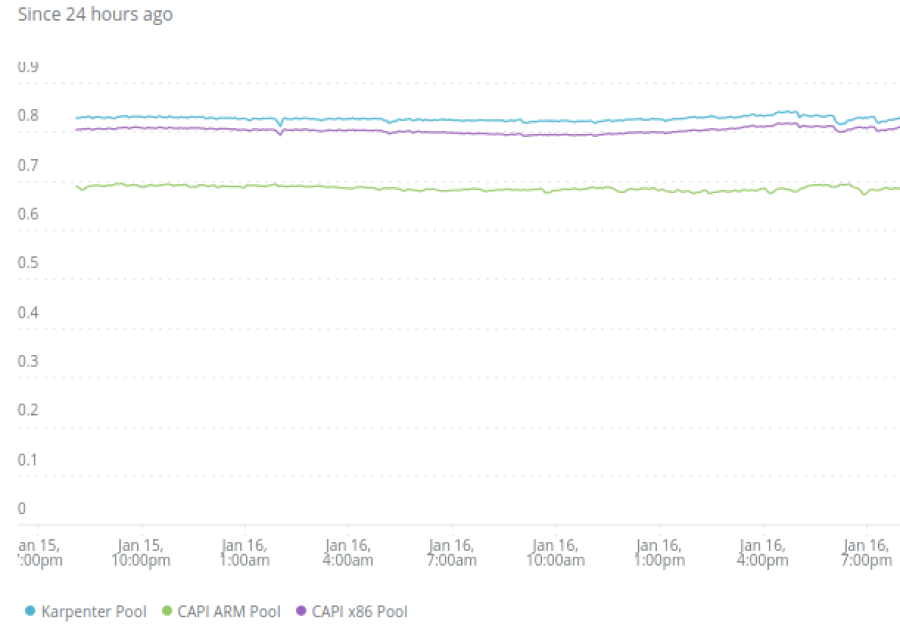
An analysis of bin packing effectiveness percentage over time for Karpenter-backed pools and non-Karpenter pools (managed by Cluster API, with Cluster Autoscaler enabled) is shown in this picture. We can see that bin packing efficiency is higher for our Karpenter Pools (around 84%), and in consequence we’re allocating resources more efficiently:
When implementing Karpenter as your autoscaling tool, consider checking the Evicted Pods and Nodes Consolidation events, accessible through the Kubernetes Events Integration. You can use some NRQL queries like these ones to check those events and observe how Karpenter has performed in the last hour:
FROM InfrastructureEvent SELECT uniqueCount(event.involvedObject.name) AS 'Pods Evicted' WHERE event.source.component = 'karpenter' WHERE event.reason IN ('Evict', 'Evicted') AND event.message = 'Evicted pod' LIMIT MAX COMPARE WITH 24 hour ago
FROM InfrastructureEvent SELECT uniqueCount(event.involvedObject.name) as 'Node Consolidation Events' WHERE event.source.component = 'karpenter' WHERE event.reason IN ('ConsolidateTerminateNode', 'ConsolidateLaunchNode', 'DeprovisioningTerminating') LIMIT MAX COMPARE WITH 24 hour ago
The output should be similar to this one:
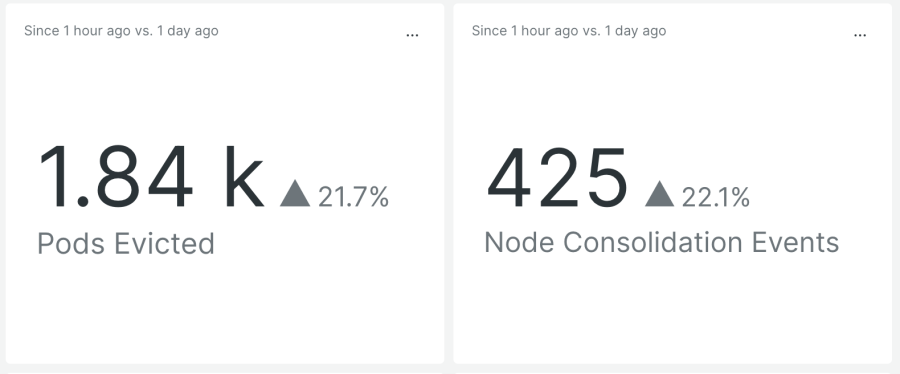
Based on this data, you should assess how Karpenter's actions are impacting your services reliability (since many pods are being evicted), as well as adjust Karpenter's configuration to regulate its aggressiveness regarding node consolidation events.
Using Karpenter in our clusters has reduced costs by over 15%, only using a specific instance type. We expect to increase this percentage as we add more instance types (we call it the “Mixed Instances pool”) for a Karpenter-managed node pool.
x86 vs ARM architecture
Another optimization that can be a big cost-saver is evaluating different underlying processors. While many folks run on x86, we have found cost savings by leveraging ARM for certain workloads. ARM processors currently have an advantage over Intel in their performance per watt and thus are more energy efficient for a given compute task. This results in lower per-hour instance costs, which means cost savings and a smaller carbon footprint.
The potential for cost savings depends heavily on the characteristics of the workload. Therefore, it is important to first identify the right potential workloads. This can be accomplished by looking at the following metrics:
- CPU utilization: A high CPU utilization means it might be a good service to convert to ARM.
- Pod Count: A stable pod count means it might be a good service to convert.
- Service-specific metrics: For example, if you have an http service check how Requests Per Minute (the more is better), affect your service while experimenting with different instance types.
This example below shows the CPU utilization for a service, that we were running in two different clusters with different CPU characteristics. After repeating the load testing for 20, 40, and 60 users, we confirmed that the ARM instance was not a good fit for this particular workload.
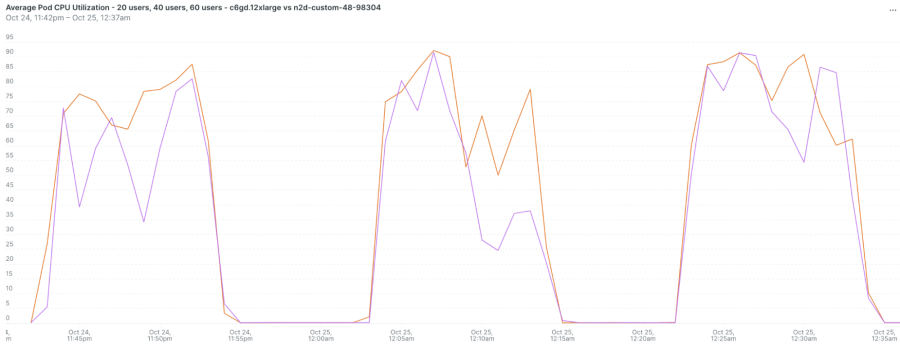
In order to determine whether the workload is a good match, ensure that the service running on ARM instances has not experienced performance degradation, and conduct a cost comparison. You should count how many x86 nodes vs. ARM instances you need to get similar performance results (you can use NRQL queries from previous sections) and the costs of each option.
Easter egg: if your business operate in AWS and requires data encryption for regulatory compliance, Graviton 3 instances (ARM instances provided by AWS) combined with Amazon Corretto Crypt Provider libraries offer optimal performance for addressing the use of ARM instances for such workloads.
Spot Instances
Our last suggested optimization is to leverage Spot Instances. A Spot Instance is a compute instance (EC2 or Virtual Machine, depending on Cloud Provider terminology) that makes use of extra compute capacity and therefore tends to have a lower price point. You can request underutilized compute instances from cloud providers at steep discounts, but as a trade-off, you run the risk of them being interrupted without much notice. When that happens, you will have at least two minutes to shift your workload to an unoccupied instance. Moreover, a spot price is the hourly cost of a Spot Instance, and each cloud provider determines the spot price for each type of instance in each availability zone and region. This price is then gradually changed, based on the supply and demand for Spot Instances over the long term. So, it’s extremely important to take into account that Spot Instances run whenever capacity is available.
As a result of all this, they are a cost-effective choice if your workloads are variable and can be flexible about when your apps run and if your application can be interrupted. Some good workloads examples include:
- “Hot spare” instances. An example of this are workloads like CI/CD agents.
- Those easily-interrupted OLTP (OnLine Transaction Processing) workloads could also be a good potential candidate for Spot Instances.
- Workloads which can be time-shifted (batch processing, cron-style executions).
To understand how Spot Instances are behaving, we analyze:
- Overall data regarding Spot Instances usage, based on K8sNodeSample data
- Kubernetes Nodes Events, useful for tracking service interruptions and node termination handler events based on InfrastructureEvent data
As already mentioned, it is very important to observe how each Spot Instance type is interrupted by the cloud provider and if there is any significant variance between Availability Zones.
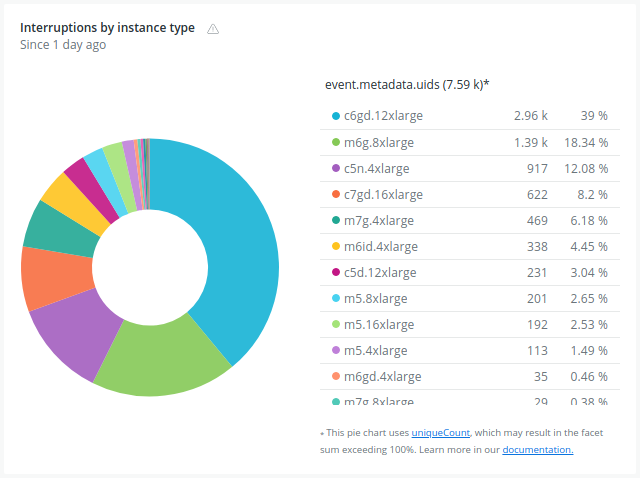
Some useful NRQL queries for achieving these, are:
- Interruptions per instance type:
FROM InfrastructureEvent select uniqueCount(event.metadata.uid) where event.source.component = 'aws-node-termination-handler' and event.reason in ('RebalanceRecommendation', 'ScheduledEvent', 'ASGLifecycle', 'SpotInterruption', 'StateChange', 'UnknownInterruption') facet event.reason, `event.metadata.annotations.instance-type` timeseries max limit max since 1 day ago
- Interruptions per AZ:
FROM InfrastructureEvent select uniqueCount(event.metadata.uid) where event.source.component = 'aws-node-termination-handler' and event.reason in ('RebalanceRecommendation', 'ScheduledEvent', 'ASGLifecycle', 'SpotInterruption', 'StateChange', 'UnknownInterruption') facet event.reason, `event.metadata.annotations.availability-zone` timeseries max limit max since 1 day ago
Conclusion
Achieving cost-effectiveness is one of the top priorities for any business that operates in the cloud. This post explores a number of methods and approaches including right-sizing, autoscaling, and leveraging Spot Instances or ARM processors. Even though some of them can be quite challenging, at New Relic we have applied these techniques to reduce our compute costs.
By dynamically adjusting resources, preventing overprovisioning, and embracing innovative solutions like Karpenter, businesses can not only enhance performance and reliability but also realize significant and sustainable cost savings in their cloud operations.
Additionally, observability practices enable continuous monitoring and fine-tuning, thus ensuring effective resource utilization. Together, these measures not only improve application performance and reliability but also lead to a streamlined and cost-effective cloud infrastructure, aligning resource usage with actual requirements and reducing overall cloud expenditures.
As opiniões expressas neste blog são de responsabilidade do autor e não refletem necessariamente as opiniões da New Relic. Todas as soluções oferecidas pelo autor são específicas do ambiente e não fazem parte das soluções comerciais ou do suporte oferecido pela New Relic. Junte-se a nós exclusivamente no Explorers Hub ( discuss.newrelic.com ) para perguntas e suporte relacionados a esta postagem do blog. Este blog pode conter links para conteúdo de sites de terceiros. Ao fornecer esses links, a New Relic não adota, garante, aprova ou endossa as informações, visualizações ou produtos disponíveis em tais sites.


