“Monitor all the things” is a mantra we take seriously at New Relic, and our continued investment in providing ready-to-use, on-host integrations keeps moving us closer to that goal. The latest step comes with our release of the Apache integration for New Relic infrastructure monitoring.
Apache is an open source, cross-platform web server distributed under the Apache License version 2.0. Because of its durability, battle-tested SSL security, and dedicated user base, it’s one of the most widely used web servers in production on the Internet. The integration is available for customers with a subscription to New Relic Infrastructure Pro. New Relic Infrastructure processes, displays, alerts on, and analyzes the change and performance data about your on-premise or cloud infrastructure—running on traditional servers or in containerized clusters.
With our infrastructure monitoring integration, you can use New Relic to collect valuable performance metrics and inventory data from your Apache web servers to help you gain complete visibility into your underlying infrastructure. Metrics and inventory data are sent to Infrastructure and New Relic Insights, which include pre-built dashboards of your Apache metric data. You can also easily create alert policies and your own custom queries and charts in Insights.
Our goal for this integration? To help you better manage your Apache infrastructure with speed and agility so you can do everything possible to meet your critical business goals.
Critical performance and health metrics for monitoring Apache web servers
The Apache Integration captures key performance metrics and attaches them to the ApacheSample event type.
Using the metrics command, the integration collects the following metric data attributes:
- Requests per second, by host
- Status of busy workers
- Total, idle, and busy workers
- Bytes sent per second, by host
- Bytes sent per request, by host
The integration’s inventory command captures the version numbers from running Apache instances and from all loaded Apache modules, using Apache's binary file.
Troubleshoot Apache web servers faster
You can find your data in the New Relic UI by clicking Infrastructure > Integrations > On-host integrations and then selecting the Apache integration link.
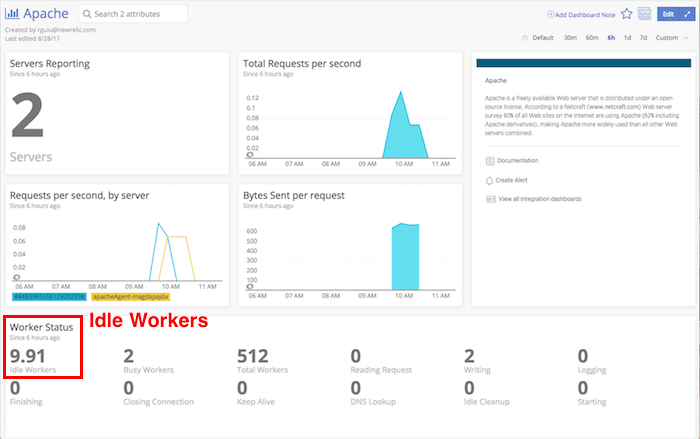
To be sure your web server is running optimally, you need to know if outages or bottlenecks are causing a poor customer experience. For example, let’s say you get alerted that the latency of your website has increased significantly—something that will definitely affect customer experience. With the Apache integration installed, you can use the preconfigured dashboard in Insights to quickly check on exactly how many Apache workers are idle or busy:

You’ll know right away if you’ve reached the maximum amount of processes allowed—or where other processes are occupied. And this could likely be the cause of your website’s increased latency. This is just one example of how the integration can help you optimize your Apache infrastructure.

Get started with the Infrastructure Apache integration
This integration is compatible with Apache versions 2.2 or 2.4 and requires that you enable and configure the Apache status module for each Apache instance. For installation, configuration, and exact compatibility requirements, check out Apache monitoring integration for New Relic Infrastructure in our documentation.
With the New Relic Infrastructure Apache Integration, you've got easy access to the information you need to keep your Apache web servers running at peak efficiency. Don't let slow web servers ruin your organization's digital customer experience. For more related integrations, check out Infrastructure Redis and Infrastructure StatsD.
이 블로그에 표현된 견해는 저자의 견해이며 반드시 New Relic의 견해를 반영하는 것은 아닙니다. 저자가 제공하는 모든 솔루션은 환경에 따라 다르며 New Relic에서 제공하는 상용 솔루션이나 지원의 일부가 아닙니다. 이 블로그 게시물과 관련된 질문 및 지원이 필요한 경우 Explorers Hub(discuss.newrelic.com)에서만 참여하십시오. 이 블로그에는 타사 사이트의 콘텐츠에 대한 링크가 포함될 수 있습니다. 이러한 링크를 제공함으로써 New Relic은 해당 사이트에서 사용할 수 있는 정보, 보기 또는 제품을 채택, 보증, 승인 또는 보증하지 않습니다.


