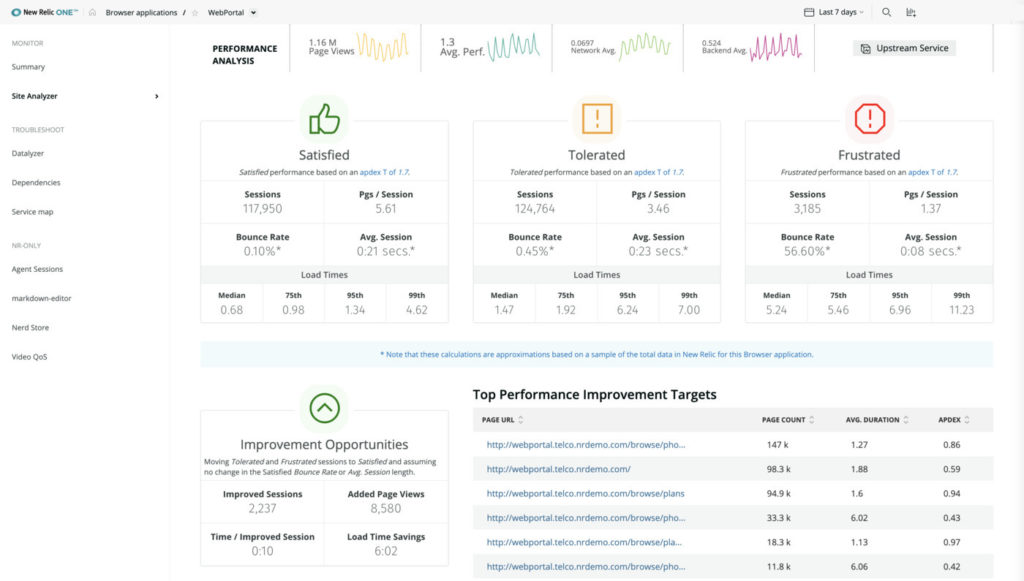
Imagine an internet where every page load is instantaneous; every tap on a mobile app yields a response that’s fast and flawless. Sounds lofty, but it’s a vision worth striving for. In fact, we’ve built our entire mission on this idea: To instrument, measure, and improve the internet to help our customers create more perfect software, experiences, and businesses.
At New Relic, we believe that your digital strategy is your company strategy. You use software to uncover revenue streams, transform your customer experience, and outpace your competitors. With that much on the line, software matters more than ever. Innovation and rapid delivery are crucial.
As software operations and delivery have changed, so have monitoring practices. You need the ability to instrument everything in your software stack and to view all your telemetry data in one place. But you also need context and curation to make sense of all that data. And intelligence to know what to take action on.
We’ve built the platform to get you there.
New Relic One is the first observability platform—it’s open, connected, and programmable:
- The New Relic platform is open. Extend observability of your entire digital landscape with APIs that allow you to send third-party metrics and trace data to New Relic. Use that data alongside data from New Relic instrumentation to more quickly troubleshoot and resolve issues in your software stack.
- The New Relic platform is connected. We apply the intelligence and visualizations you need to create meaningful connections and context between the entities that make up your systems.
- The New Relic platform is programmable. Start with our curated experience and build completely custom user interfaces on top of it to unlock the full value of your data and understand your system on your terms.
Read on to learn more about the capabilities we’re announcing at FutureStack 19 that make New Relic One a true observability platform.
New Relic One—the first programmable observability platform
Over the years, we’ve partnered with thousands of customers to create more data-driven cultures. We’ve helped companies transform themselves into organizations in which success is measured not only by how quickly and frequently they ship software updates, but also by the quality of their customer experience.
In partnering with these companies, they’ve made it clear that they need more specific solutions—solutions that model their business, not just their technology. For example, dashboards are great—they’re flexible and powerful tools we all use every day. They’re a critical part of our platform. But sometimes, for the complex environments we manage today, they just aren’t enough. Knowing this, we began to ask ourselves: How do we meet all the diverse use cases we encounter? How do we deliver real value to our customers faster? How do we help our customers keep up with the speed of change in the market?
By making New Relic One a programmable platform, we’ve made it possible for you to build applications—custom user interfaces deployed in New Relic One—that connect your observability data, gathered from myriad sources—including third-party open source data—all in one place. And we’ve made it so easy that a developer can have an application up and running in an hour. We’ve even built a set of open source applications you can deploy and use immediately!
As a programmable platform, New Relic One gives you control of its fundamental building blocks. Using React, GraphQL, and the New Relic Query Language (NRQL), you’ll be able to:
- Build React JS applications that reside in New Relic One and feature customized data visualizations and interactive interfaces.
- Use our library of React components and example applications to construct your own modular New Relic One applications.
- Build your applications to record and visualize data from any source, whether it’s New Relic-reported data or data pulled from third-party services or databases.
Building applications on New Relic One complements, and is not meant to replace, the curated experience you expect from New Relic via custom charts and dashboards. We’re not changing anything about the New Relic you use every day. We’re simply giving you more power on our platform. If you can imagine it, you can build it.
For more, see this blog post and the New Relic Developers site.
New Relic Logs
In our digital economy of “online” everything, enterprises are building efficient but highly complex microservices architectures in the cloud in order to provide seamless user experiences to their customers. The log data generated by these cloud-based applications has rendered traditional on-prem log monitoring solutions as no longer viable. Scaling on-host logging clusters is time consuming, expensive, and increases unnecessary toil.
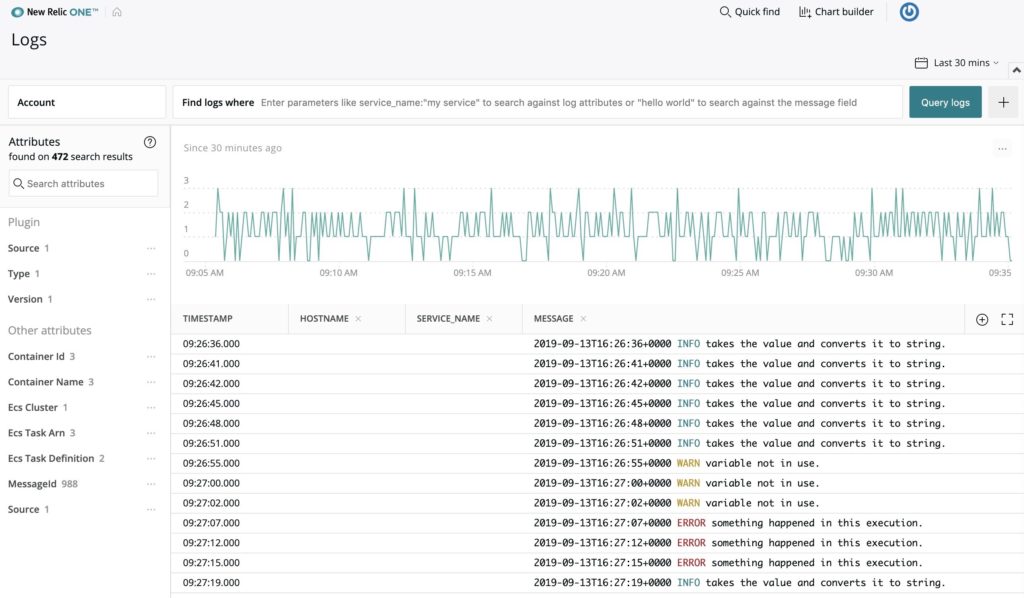
New Relic logs is the tool for cloud-native applications. As part New Relic One, New Relic Logs simplifies monitoring of microservices-based applications by gathering log data from dispersed systems to provide powerful analytics, visualizations, and alerts on the aggregated data set. Further, the co-location of log messages with New Relic APM and New Relic Infrastructure events, metrics, and traces allows you to more fully observe your system and more quickly resolve production issues and reduce mean time to resolution (MTTR).
For more, see this blog post and the New Relic documentation.
Open instrumentation: New Relic Metrics and Traces APIs
Metrics, events, logs, and traces are the core telemetry data types that enable observability of the modern software stack. The continual maturation of DevOps and open source tooling has put developers in the driver’s seat for observability-driven instrumentation. In fact, more data than ever is available from sources within business-critical applications and infrastructure, and methods for correlating and visualizing that data in meaningful ways are just as varied.
At New Relic, we’re more excited than ever to say that we’re all in on the future of observability, and we believe that future holds huge promise for New Relic customers. It’s our goal to provide modern software teams a single platform on which they can combine logs, agent-based APM and Infrastructure data, and third-party telemetry data to create an entity-centric system of record that illuminates their entire stack.
To that end, we’ve added critical open instrumentation capabilities to the New Relic platform; specifically, two new APIs: New Relic Metrics and New Relic Traces, both powered by the new Telemetry SDK.
See this blog post, or read more about the New Relic Metrics API and New Relic Trace API in the documentation.
New Relic AI
New Relic AI empowers your DevOps, site reliability engineering, and network management teams with intelligence and automation to proactively detect and resolve incidents faster. It gives you the ability to automatically correlate, aggregate, and prioritize your incident data across the tools you already use, reducing alert fatigue and driving faster MTTR.
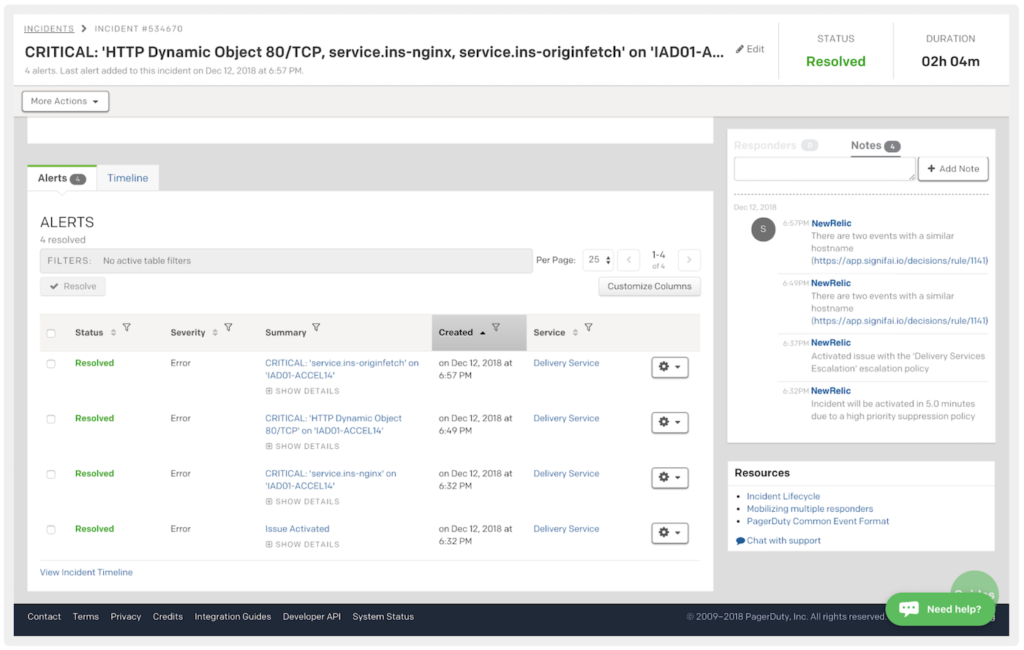
New Relic AI integrates with dozens of data sources, including PagerDuty and Slack, to automatically enrich incident data with relevant context and ML-powered guidance and suggestions. With a live view of ingested data, an intelligent summary of each incident, and the ability to tune correlations with user feedback, you’ll more easily:
- Accelerate incident response: Reduce the amount of time it takes to detect, prioritize, diagnose, and resolve incidents with the help of contextual enrichment automation.
- More quickly identify the root cause: Quickly diagnose the underlying reasons for performance problems, and resolve incidents before they impact your customers. New Relic correlates and enriches incident data with context and gives you an intuitive experience to explore and query data, so you can quickly determine the root cause of issues and get to faster MTTR.
- Improve change success rate: Use artificial intelligence and machine learning to capture team knowledge and learn from past incidents so you can better predict them before they happen in the future. This unleashes your teams to move faster with confidence, deploy changes with fewer incidents, and improve your change success rate.
New Relic AI is currently in private beta. Contact us to learn more about this beta program.
New Relic React Native Mobile Agent
Observability should lead to a full understanding of how your software’s performance affects your customers. But your customers’ behavior is changing: Now more than ever, they expect to access your software via mobile applications, as opposed to standard web browsers.
New Relic Mobile bridges the gap between your backend system and your mobile application’s frontend, giving you a clear picture of how the health of your app affects everything from your business goals to your brand image to your technical roadmap.
Mobile application development and maintenance harbors different concerns than that of traditional application development. The proliferation of mobile platforms makes it harder than ever to create a unified mobile experience—an issue the React Native framework solves for many teams. Nevertheless, it’s an increasingly high-risk proposition to develop mobile applications on any framework without monitoring their performance throughout development and production.
The New Relic React Native Mobile Agent brings application performance monitoring to hybrid app developers. With the React Native Mobile Agent, React Native developers will be able to harness the capabilities of New Relic One to instrument, measure, and improve the performance of their applications.
Key benefits of the React Native Mobile Agent include:
- Framework flexibility: Build your mobile application in the framework of your choice. The new agent now supports hybrid (React Native) and native (IoS and Android) frameworks. Take advantage of a best-in-class observability solution without sacrificing your chosen framework.
- Customer-centric observability: Built for compatibility with New Relic One for deep, direct insight into how the performance of your stack affects your end users. Gain access to capabilities like global trace search, dashboards, and chart builder for a connected platform experience on which you can build a highly performant digital customer experience.
- Crash monitoring: Over 80% of users delete a mobile app after just two crashes. Avoid this pitfall by quickly troubleshooting crashes and debugging your code for higher customer retention and engagement.
- JavaScript errors and native crashes pinpointed and deminified: The JS errors UI in New Relic shows where crashes and errors occur in your JavaScript code, so that you can quickly fix the issues before they affect your users.
- Custom attributes, events, and mobile breadcrumbs: Filter and facet by the attributes that are most important to you; understand component timing; and build more performant apps for your users by better understanding their in-app experience.
The React Native mobile agent will enter private beta October 2019. If you’d like to get involved in the beta program, let us know.
Essential platform capabilities in New Relic One
The following capabilities are essential tools for modern software teams looking to increase observability and reduce unnecessary toil.
Entity explorer
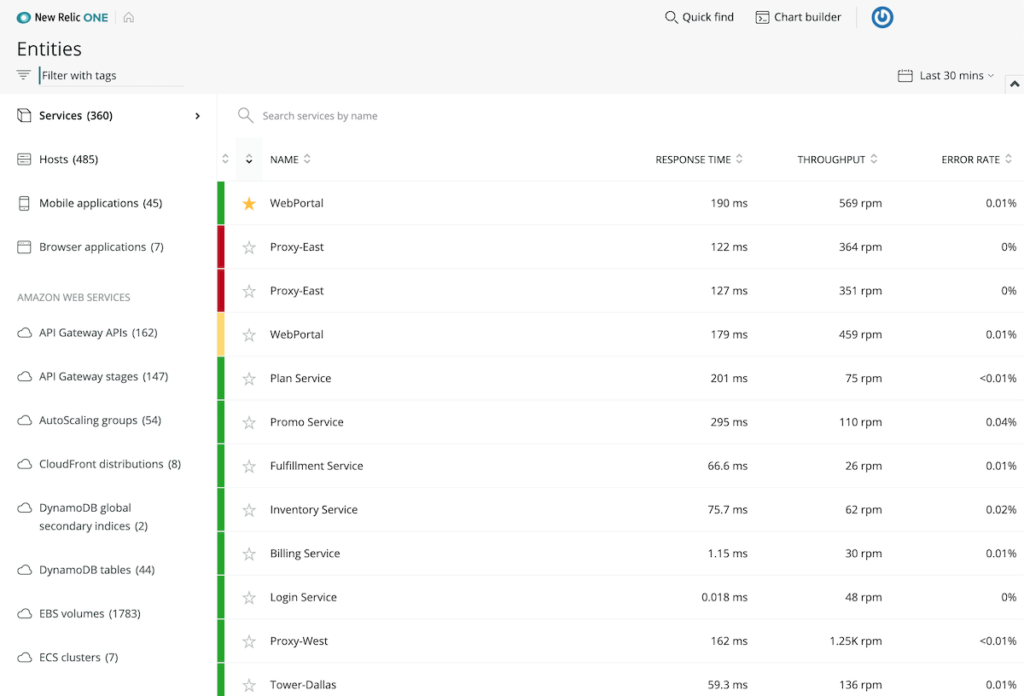
An entity can be something you monitor directly, like applications and microservices; or indirectly, like data centers. An entity emits data, and that data provides context about the internal state of the entity.
The entities you care about likely span several New Relic accounts and products. When you’re troubleshooting a problem, you need quick summary data to know if a service, mobile app, or cloud integration warrants further investigation. The New Relic One entity explorer shows you every entity from every account and gives you an organized navigation layer so you can see everything you monitor in one place, and quickly zoom into what you care about most.
For more on the New Relic One entity explorer, see the New Relic documentation.
New Relic Serverless for AWS Lambda
New Relic Serverless for AWS Lambda is a set of features that let you monitor, visualize, troubleshoot, and alert on your functions. You get key data about each individual function; for example, New Relic uncovers aggregate performance data like throughput and error rates, and combines it with individual invocation data, including the invocation source, request component timing (external service requests, etc.), errors, and other data critical for troubleshooting. In other words, you’ll get the views you need to monitor overall activity; and you can use that information to investigate specific requests when errors surface, all without the burden of managing disparate monitoring tools.
Learn how to monitor your Lambda functions in the New Relic documentation.
New Relic Kubernetes Cluster Explorer
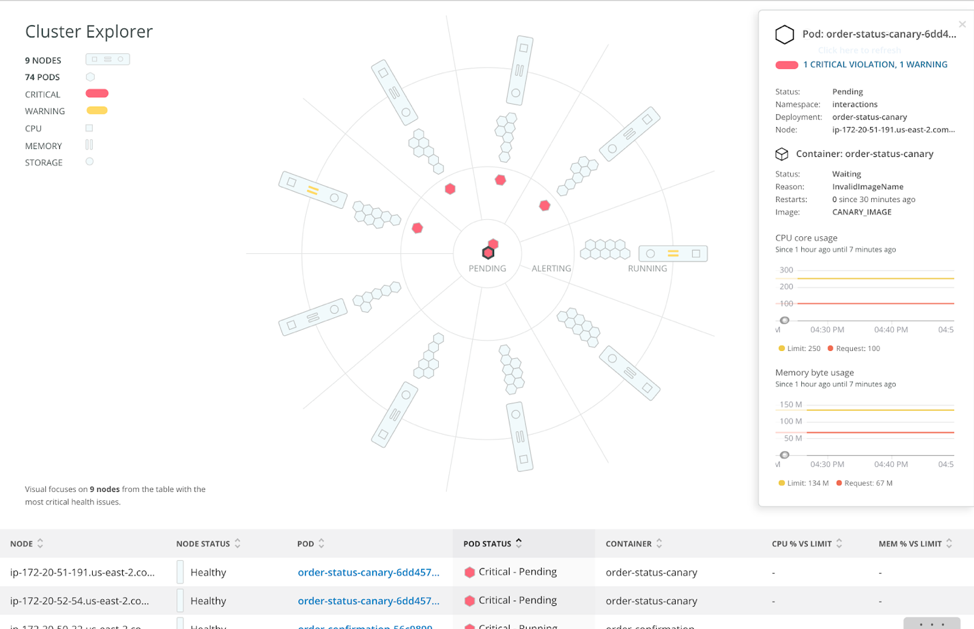
Cluster explorer applies advanced capabilities to filter, sort, and search for Kubernetes entities; to understand the relationships and dependencies within an environment; and then employs data-visualization techniques that give customers a fast and intuitive path to getting answers and understanding their Kubernetes environments. It’s a powerful and innovative solution to the challenges associated with running Kubernetes at massive scale.
A multi-dimensional representation of a Kubernetes cluster allows teams to drill down into Kubernetes data and metadata in a high-fidelity, curated UI that simplifies complex environments.
Use cluster explorer to observe performance and dependencies across any Kubernetes environment, and to troubleshoot failures, bottlenecks, and other abnormal behavior—helping ensure that their applications are always available, running fast, and doing what they’re supposed to do.
Dashboards and chart builder
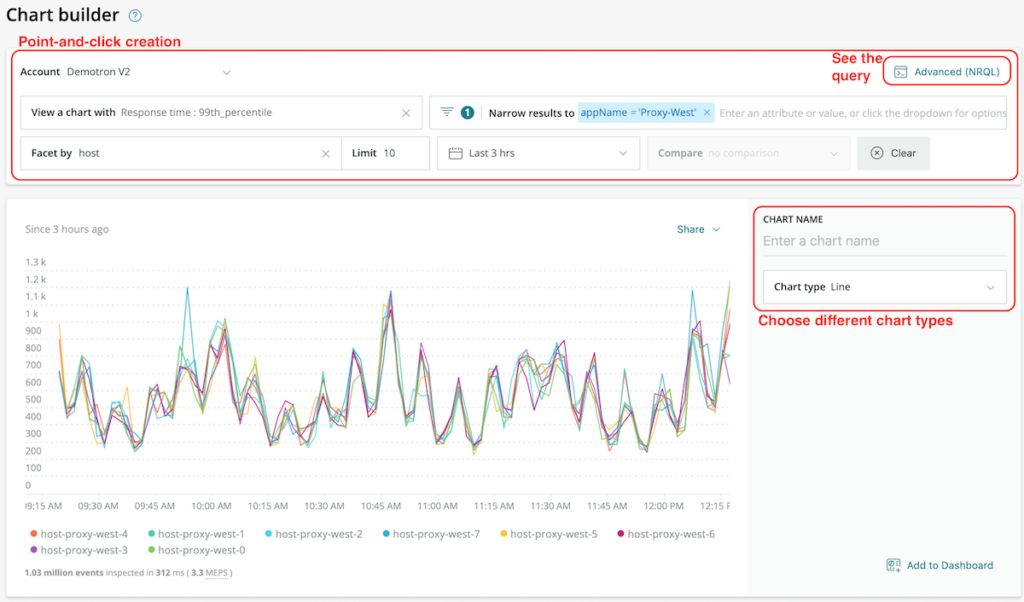
With the New Relic One chart builder, you get an intuitive point-and-click interface for interacting with the New Relic Query Language to create dashboard charts. You select a query type (response time, for example) against specific sources (such as hosts), and then narrow and shape the results (filtering by name, location, a defined length of time, and other parameters). You can also compare multiple data sets (useful for identifying correlations) and choose the type of visualization they want to use. Advanced users can use the chart builder to craft and edit NRQL queries directly.
Along with a number of other exciting enhancements, New Relic One dashboards bring three capabilities designed to make it easier to create and manage dashboards:
- Create, customize, and clone dashboards from anywhere in the New Relic platform, using almost any available data source. It’s now possible, for example, to save service maps as a custom widget and then add that widget into a dashboard. Any dashboard can display any type of visualization or data source; no need to define in advance a dashboard type or otherwise limit how you use a particular dashboard.
- The GraphQL tag API makes it easy to organize and search across dashboards, and to favorite dashboards. All New Relic customers can benefit from quick, personalized access to dashboards when and where they’re needed.
- Support for dashboard (and chart-level) CRUD (Create, Update, Delete) controls within chart action menus. If you have permission to access a dashboard, you also have easy access to these basic management capabilities.
Learn more about New Relic One dashboards and chart builder in this blog post.
One platform to achieve true observability
As an open, connected, and programmable platform, New Relic One gives you the tools necessary to achieve observability:
- Navigate to the deepest levels of data granularity when you need to, and craft tailored, curated visualizations that are unique to your business.
- Form a unified view of your customers’ experience across your digital properties and tie that information back to the performance of your underlying apps and systems.
- Give everyone who has a hand in creating and delivering software in your organization—from product owners to designers to developers to operators and support teams—a common understanding of how your software impacts the experience customers have with your business.
Now more than ever, New Relic’s observability platform that lets you create more perfect software, experiences, and businesses—all towards the goal of a more perfect internet.
New Relic One is available to all New Relic customers with a Pro subscription or to those engaged in a free trial. When you’re ready to get started, visit New Relic One.
This post contains “forward-looking” statements, as that term is defined under the federal securities laws, including but not limited to statements regarding new capabilities of New Relic One and additional announcements at New Relic’s FutureStack events, including the timing, benefits and availability of new products, innovations, and capabilities and the potential value and solutions that these can bring to customers. The achievement or success of the matters covered by such forward-looking statements are based on New Relic’s current assumptions, expectations, and beliefs and are subject to substantial risks, uncertainties, assumptions, and changes in circumstances that may cause New Relic’s actual results, performance, or achievements to differ materially from those expressed or implied in any forward-looking statement. Further information on factors that could affect New Relic’s financial and other results and the forward-looking statements in this post is included in the filings New Relic makes with the SEC from time to time, including in New Relic’s most recent Form 10-Q, particularly under the captions “Risk Factors” and “Management’s Discussion and Analysis of Financial Condition and Results of Operations.” Copies of these documents may be obtained by visiting New Relic’s Investor Relations website at http://ir.newrelic.com or the SEC’s website at www.sec.gov. New Relic assumes no obligation and does not intend to update these forward-looking statements, except as required by law.
이 블로그에 표현된 견해는 저자의 견해이며 반드시 New Relic의 견해를 반영하는 것은 아닙니다. 저자가 제공하는 모든 솔루션은 환경에 따라 다르며 New Relic에서 제공하는 상용 솔루션이나 지원의 일부가 아닙니다. 이 블로그 게시물과 관련된 질문 및 지원이 필요한 경우 Explorers Hub(discuss.newrelic.com)에서만 참여하십시오. 이 블로그에는 타사 사이트의 콘텐츠에 대한 링크가 포함될 수 있습니다. 이러한 링크를 제공함으로써 New Relic은 해당 사이트에서 사용할 수 있는 정보, 보기 또는 제품을 채택, 보증, 승인 또는 보증하지 않습니다.

