Since its launch in 2014, AWS Lambda has grown to serve hundreds of thousands of customers generating trillions of function invocations a month. For modern software engineers, the benefits are clear: AWS Lambda is an event-based serverless computing platform, with built-in autoscaling and infrastructure management, on which engineers can build and modify single-purpose functions without worrying about the underlying compute resources.
Despite Lambda’s rapid adoption, though, there’s been a noticeable lag in the development of monitoring solutions. Since Lambda’s inception, teams have been calling for a robust monitoring solution to help with:
- Faster troubleshooting and alerting. When errors occur in your AWS Lambda application, you need alerts and immediate insights into those errors; you can’t waste time diving into logs to troubleshoot complex outages.
- Managing application scale. Scaling a DIY solution can be full-time work. You’ll save time and resources with tooling built to handle your growing workloads.
- Controlling complex environments. This is especially important if you manage a distributed system running AWS Lambda functions alongside other services, whether they are legacy services, or more modern components built on Kubernetes or other container-based environments. You need to see everything at a high level while also having the ability to drill down into individual errors quickly when something goes wrong. And this all needs to happen in one place, in real time—using a single tool, on one platform.
Today we're announcing New Relic monitoring for AWS Lambda in the New Relic One platform.
New Relic monitoring for AWS Lambda is a set of features that let you monitor, visualize, troubleshoot, and alert on your functions. You get key data about each individual function; for example, New Relic uncovers aggregate performance data like throughput and error rates, and combines it with individual invocation data, including the invocation source, request component timing (external service requests, etc.), errors, and other data critical for troubleshooting. In other words, you’ll get the views you need to monitor overall activity; and you'll be able to use that information to investigate specific requests when errors surface, all without the burden of managing disparate monitoring tools.
Note: New Relic monitoring for AWS Lambda is not the same as New Relic Infrastructure's AWS Lambda monitoring integration. That integration uses only CloudWatch data, while our new AWS Lambda monitoring employs CloudWatch data along with code-level instrumentation to deliver performance metrics about the applications running in AWS Lambda functions.
How New Relic monitoring for AWS Lambda works
New Relic monitoring for AWS Lambda includes automatic framework instrumentation designed specifically to run in the AWS Lambda environment, and new data collection tooling built to gather function data and send it to New Relic with negligible overhead.
Here’s how data moves from your function to New Relic:
- You instrument your function with the appropriate New Relic APM agent and configure your AWS account to send AWS Lambda logs from Amazon CloudWatch to New Relic. (More on this below.)
- When your function is invoked, log data is sent to Amazon CloudWatch.
- CloudWatch collects AWS Lambda log data and sends it to a New Relic log-ingestion function.
- The log-ingestion function sends that data to New Relic.
As we collect data about your functions, we add important metadata and tags so you can query the collected data. Your AWS Lambda monitoring data is stored in our database as events: data objects with associated attributes. Specifically, AWS Lambda data is reported as one of four event types:
- AwsLambdaInvocation event: When a function is invoked, this event captures timing data, and any associated metadata (for example, FunctionName, MemorySize, Runtime, and Version). A Lambda function’s invocation generates a single AwsLambdaInvocation event.
- AwsLambdaInvocationError event: If an error occurs when a function is invoked, this event type is generated.
- Span event: A span event is a general event used by other New Relic features (like distributed tracing). When a span is generated by a Lambda invocation, it will have Lambda-specific attributes, and include details about that span.
- Custom event: If you create a custom event for a function’s invocation, you can query that data in New Relic One dashboards.
These event types are turned into visualized data. You can view data gathered from an instrumented agent on New Relic One’s functions Summary page, or view data gathered from CloudWatch on the Metrics page.
Accessing your AWS Lambda data in New Relic One
To view your AWS Lambda data in New Relic, go to one.newrelic.com > Entities explorer > AWS > Lambda functions.
From here you can monitor functions from Summary or Metrics pages, or jump right into troubleshooting by exploring the Distributing tracing page, the Errors page, or the Invocations page (more on these below). You can also search and toggle between functions as needed, using the drop-down arrow next to a function’s name.
Summary page: view data from the instrumented agent
The Summary page displays charts that present a quick view into your function’s most important performance data:
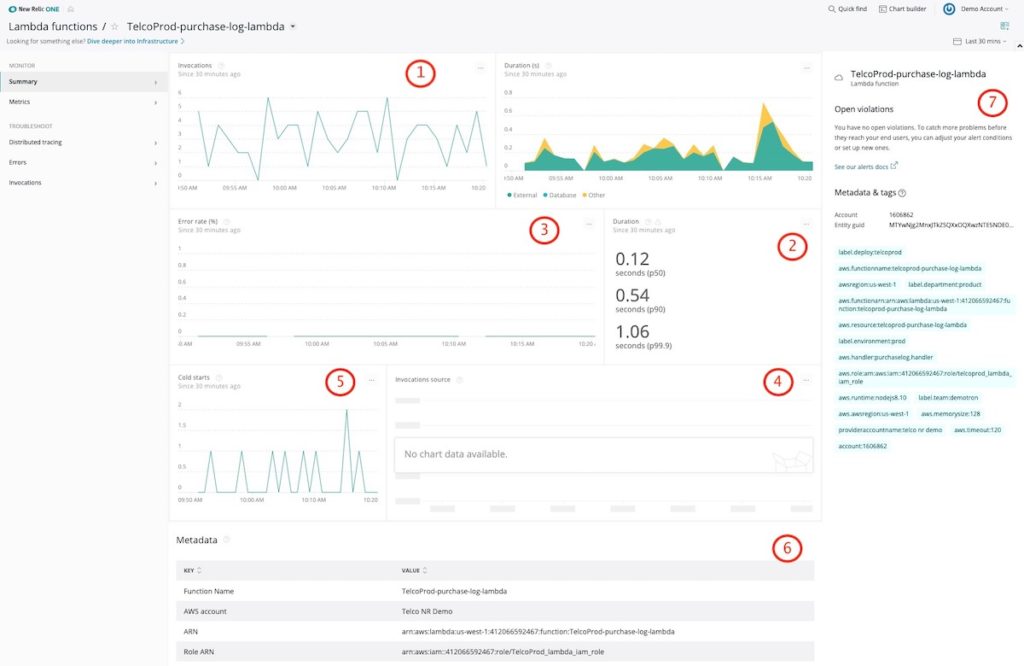
- Invocations: The total amount of times a function has been run. This includes direct REST API calls through the AWS API Gateway as well as through chained event requests.
- Duration: The total time a function ran.
- Error rate: The percentage of invocations that have resulted in errors.
- Invocation source: The list and frequency of how a function was invoked.
- Cold starts: The number of times that a function was invoked that resulted in a cold start. (If a container hosting a function is not created before the function is invoked—a cold start—the function may seem excessively slow).
- Metadata: A list of metadata describing the function.
- Details pane: A list of open violations and metadata and tags associated with the function.
Metrics page: View data from CloudWatch
The Metrics page displays AWS Lambda data collected from CloudWatch:
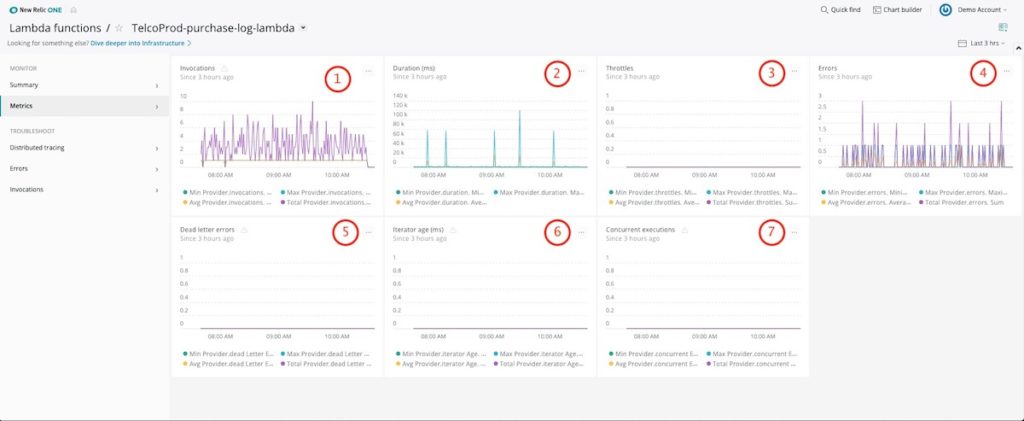
- Invocations: The total amount of times a function has been run. This includes direct REST API calls through AWS API Gateway, as well as through chained event requests.
- Duration: The total time a function ran.
- Throttles: The number of times a function has been throttled after hitting the service-defined limit for concurrent executions in an AWS account.
- Errors: The number of times an invocation has resulted in an error.
- Dead letter errors: The number of times a function was invoked via a queue, was unable to successfully run, and was left as an unfulfilled invocation request.
- Iterator age: Emitted for stream-based invocations—functions triggered by an Amazon DynamoDB stream or Amazon Kinesis stream—this measures the age of the last record for each batch of records processed. Age is calculated as the difference between the time AWS Lambda received the batch and the time the last record in the batch was written to the stream.
- Concurrent executions: Measures the sum of concurrent executions for a function at a given point in time for that specific function.
Enabling New Relic monitoring for AWS Lambda
The documentation for New Relic monitoring for AWS Lambda functions provides the requirements and compatibility information you need to get started. The process involves three steps:
- Configure AWS to communicate with New Relic. In this step, you’ll configure your AWS account and function to communicate with New Relic. You’ll also configure a New Relic log-ingestion function that will send your AWS Lambda log data to New Relic. You’ll need your New Relic license key, your New Relic API key, your New Relic account ID, and the name of your AWS linked account. Note: You perform this step via a script that you download and run in your environment. For manual alternatives to using this script, or to learn what actions the script performs, see the documentation or the AWS Lambda onboarding script in GitHub.
- Instrument your AWS Lambda code. In this step, you’ll instrument your function using a New Relic agent's language-specific functions. You’ll then upload the New Relic agent and the function to AWS. Specific instructions for adding agents to functions vary by language, so be sure to review the documentation before getting started.
- Stream CloudWatch logs to the New Relic function. In this step, you'll link your function's CloudWatch logs stream to the New Relic log-ingestion function that you configured in Step 1. Note: As in Step 1, you perform this step via a script. Manual instructions for this step are also available in the documentation.
Once everything is configured correctly and your functions are being invoked and generating data, you should see data reporting in the AWS Lambda monitoring UI in New Relic One.
Troubleshooting AWS Lambda functions in New Relic One
When troubleshooting a function, the Errors page is a great place to start. The following example shows a function for the purchase confirmation service (TelcoDT-purchase-log-lambda) in an e-commerce web portal that’s reporting an undefined error:
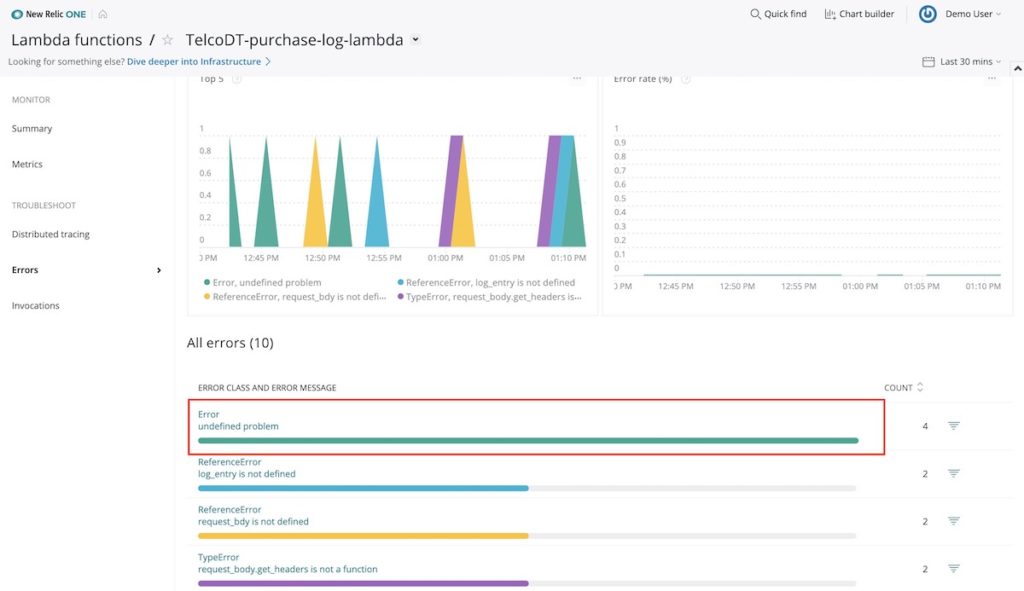
Because we’ve instrumented this function with New Relic monitoring for AWS Lambda, the New Relic agent is immediately able to pick up essential details to fill out an error trace.
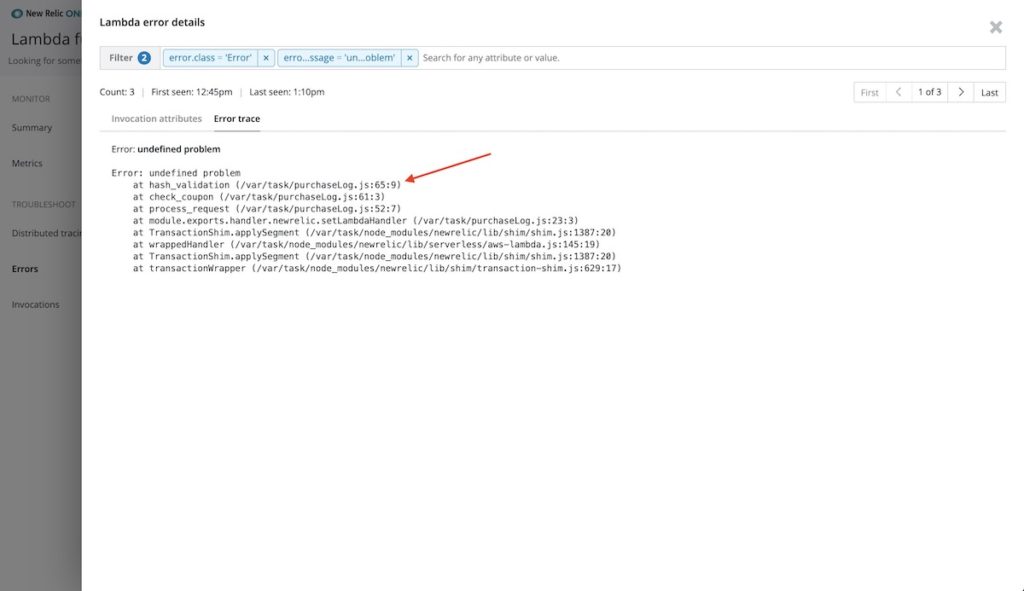
Clicking into the undefined error shows that the hash_validation logic on line 65 in the purchaseLog.js file is the culprit:
Let’s take a look at another troubleshooting example, this time using distributing tracing and the same TelcoDT-purchase-log-lambda function. The Distributed tracing page displays all the traces for a particular function. In this example, the function for the purchase confirmation service is taking longer than normal to execute—in some cases more than two seconds:
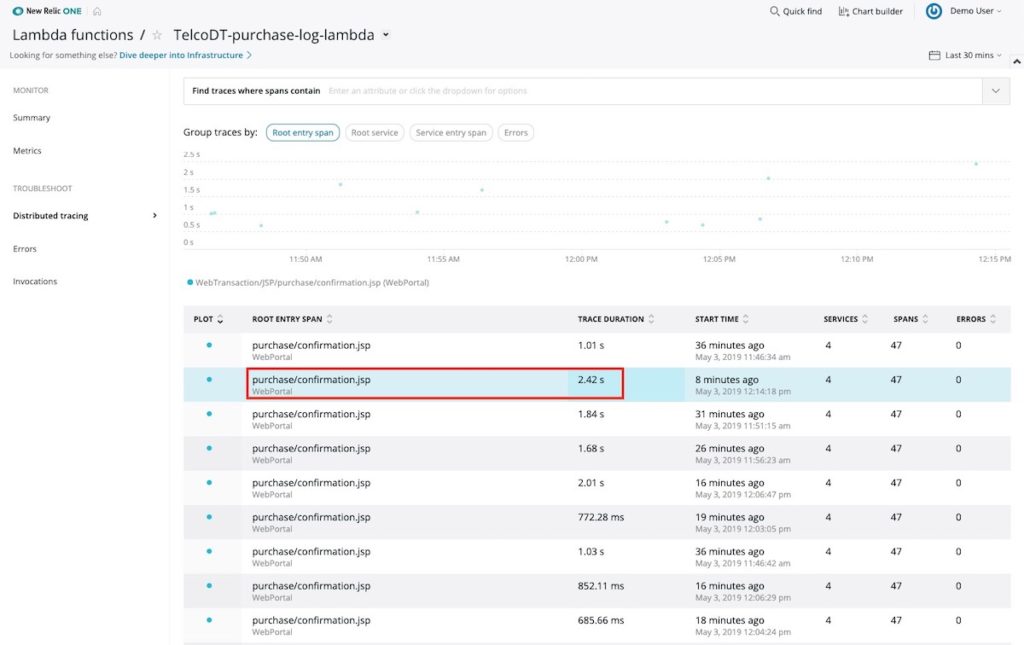
This trace has a four-service call-chain. New Relic’s distributed tracing provides the entire call-chain for functions instrumented with New Relic monitoring for AWS Lambda.
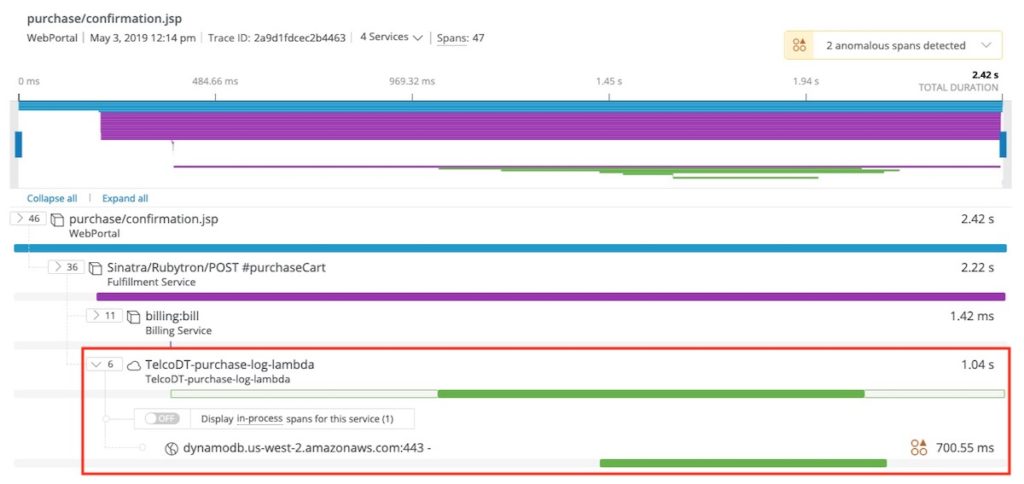
Clicking into the trace reveals that the purchase confirmation service makes a call to the fulfillment service, which, in parallel, calls the billing service and a purchase-log-lambda function. Further investigation shows the purchase log function is storing data in an external AWS service, specifically DynamoDB:
New Relic tells us that the DynamoDB span is 227% slower than average:
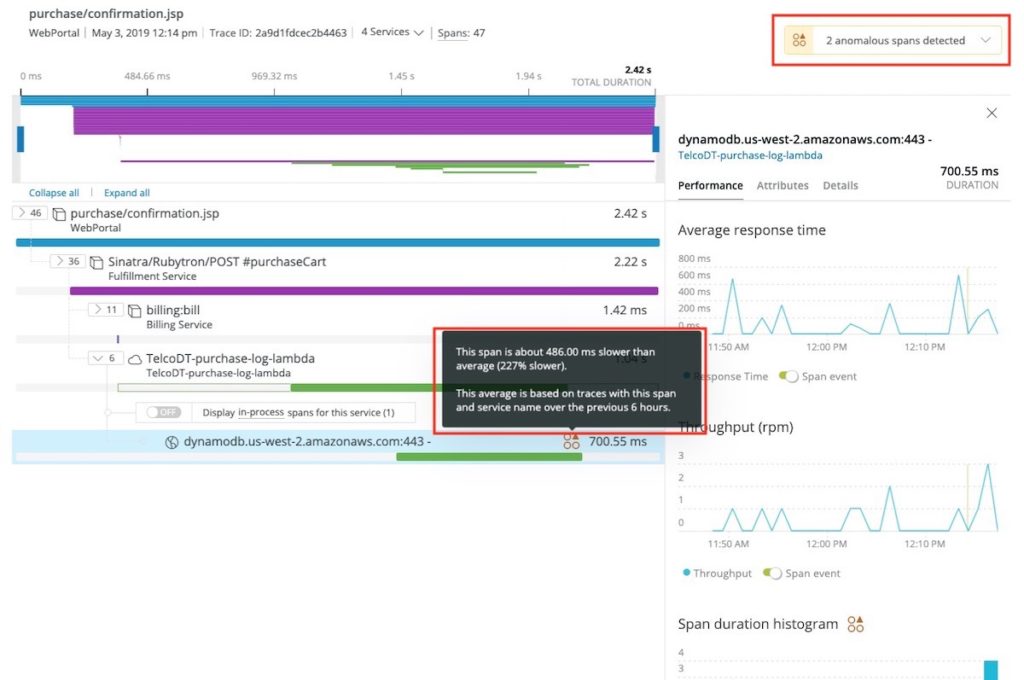
New Relic One gives you full visibility across the entire call-chain, helping you understand what’s affecting the function’s performance. Since you now know an AWS service dependency is slowing the function, you can troubleshoot if calls to the service are responsible for the slow-down; for example, is there an issue with queued HTTP requests or slow read/write operations? Even if you can’t resolve the issue, you at least have enough information to file a support ticket.
Ready to get started?
New Relic monitoring for AWS Lambda is available only in New Relic One. To access New Relic One, you must have a New Relic Pro account or be in a free trial. If you’re already using New Relic to monitor your applications or infrastructure, you already have access, and you can check out New Relic One today to start monitoring and exploring all the performance data from your AWS Lambda functions in one place.
Learn more about New Relic One at newrelic.com/platform.
Additional resources
- New Relic One
- New Relic One product page
- New Relic One press release
- New Relic One data sheet
- Introducing New Relic One: Our Platform for the Next Decade
- New Relic One: Deliver More Perfect Software Faster
- New Relic One: Why Be Entity-Centric?
- Dashboards in New Relic One: A Faster Path to Action
- Global Trace Search in New Relic One: A Better Way to Work with Custom Attributes
- New Relic documentation: Introduction to New Relic One
이 블로그에 표현된 견해는 저자의 견해이며 반드시 New Relic의 견해를 반영하는 것은 아닙니다. 저자가 제공하는 모든 솔루션은 환경에 따라 다르며 New Relic에서 제공하는 상용 솔루션이나 지원의 일부가 아닙니다. 이 블로그 게시물과 관련된 질문 및 지원이 필요한 경우 Explorers Hub(discuss.newrelic.com)에서만 참여하십시오. 이 블로그에는 타사 사이트의 콘텐츠에 대한 링크가 포함될 수 있습니다. 이러한 링크를 제공함으로써 New Relic은 해당 사이트에서 사용할 수 있는 정보, 보기 또는 제품을 채택, 보증, 승인 또는 보증하지 않습니다.


