New Relic Now Start training on Intelligent Observability February 25th.
Save your seat.
Pour le moment, cette page n'est disponible qu'en anglais.
 / 
WordPress

WordPress

Monitoring WordPress is critical to create efficient websites, blogs and apps. Download the New Relic WordPress quickstart to track your key metrics and improve performance.

What's included?

dashboards
1
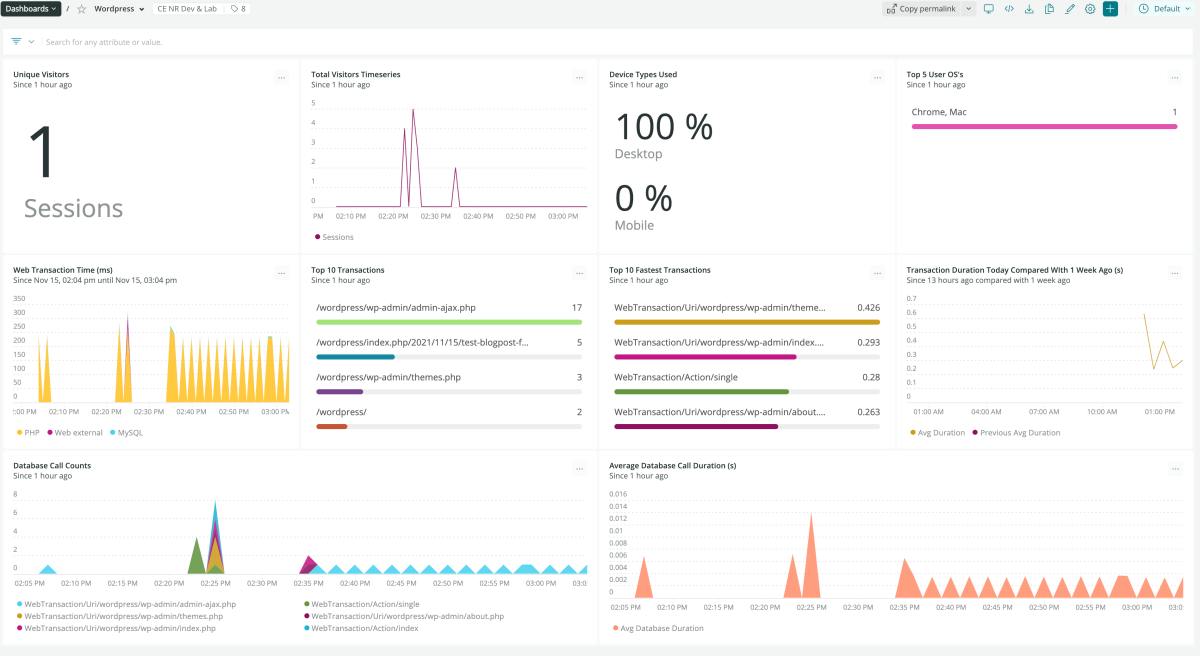
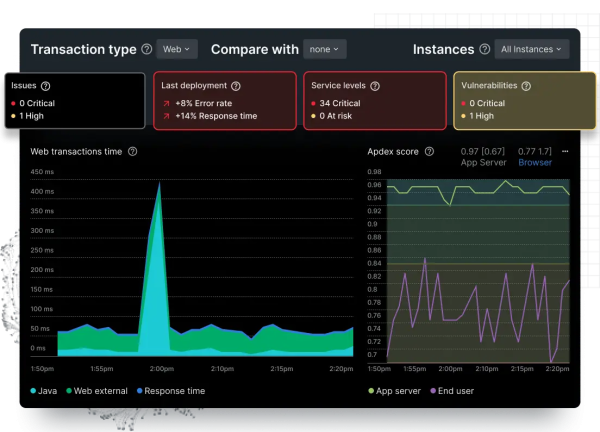
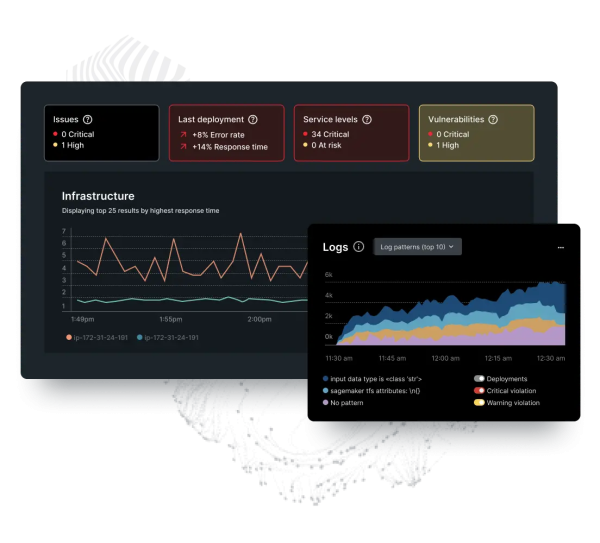
WordPress quickstart contains 1 dashboard. These interactive visualizations let you easily explore your data, understand context, and resolve problems faster.
alerts
4
WordPress observability quickstart contains 4 alerts. These alerts detect changes in key performance metrics. Integrate these alerts with your favorite tools (like Slack, PagerDuty, etc.) and New Relic will let you know when something needs your attention.
Apdex Score
This alert is triggered when the Apdex score is below 0.5 for 5 minutes
Memory Usage
This alert is triggered when Memory usage is above 90%
High CPU Utilization
This alert is triggered when the CPU Utilization is above 90%.
Transaction Errors
This alert is triggered when the the transactions fail more than 10% of the time in 5 minutes.
documentation
1
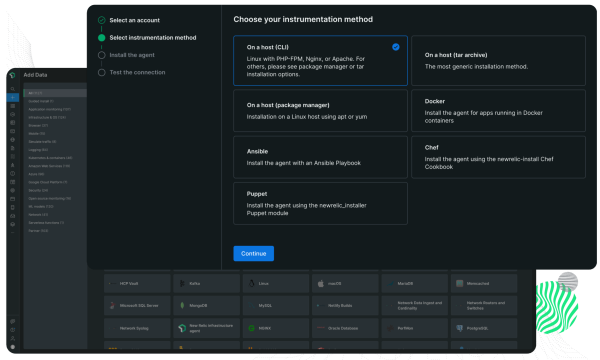
WordPress observability quickstart contains 1 documentation reference. This is how you'll get your data into New Relic.

Why monitor WordPress?

WordPress is an open source software used for creating a website, blog, or app. It is a content management system with a plugin architecture and a template system known as Themes. New Relic WordPress quickstart empowers you to monitor the performance metrics of your WordPress via our PHP agent.

WordPress quickstart highlights

The New Relic WordPress quickstart has the following features: Dashboards: Proactively monitor metrics like total visitor time series, device types used, users’ top 5 operating systems, web transaction time, and database call counts. Alerts: Get instant alerts like Apdex score, memory usage, transaction errors, and CPU utilization.

New Relic + WordPress = Optimum performance monitoring

Monitor WordPress performance with our PHP agent. The integration allows you to track the time spent within each WordPress hook, plugin, and theme. You can control which WordPress-specific metrics your app sends to New Relic by using the PHP agent's ini setting newrelic.framework.WordPress.hooks.

The dashboards provide interactive visualizations to explore the total visitor time series, device types used, users’ top 5 operating systems, web transaction time, and database call counts. With real user monitoring (RUM), New Relic measures the overall time to load an entire webpage and provides actionable insights into real users' experiences on your WordPress website. Install the New Relic WordPress quickstart today to instantly monitor WordPress key performance indicators with our PHP agent. The quickstart is the key to a seamless WordPress uptime monitoring.

How to use this quickstart

  • Sign Up for a free New Relic account or Log In to your existing account.
  • Click the install button.
  • Install the quickstart to get started or improve how you monitor your environment. They're filled with pre-built resources like dashboards, instrumentation, and alerts.
Authors
New Relic
Emil Hammarstrand
Support
BUILT BY NEW RELIC
Need help? Visit our Support Center or check out our community forum, the Explorers Hub.