Quickstart
What is Argo CD?
Argo CD is a declarative, GitOps continuous delivery tool for Kubernetes.
Why Argo CD?
Application definitions, configurations, and environments should be declarative and version controlled. Application deployment and lifecycle management should be automated, auditable, and easy to understand.
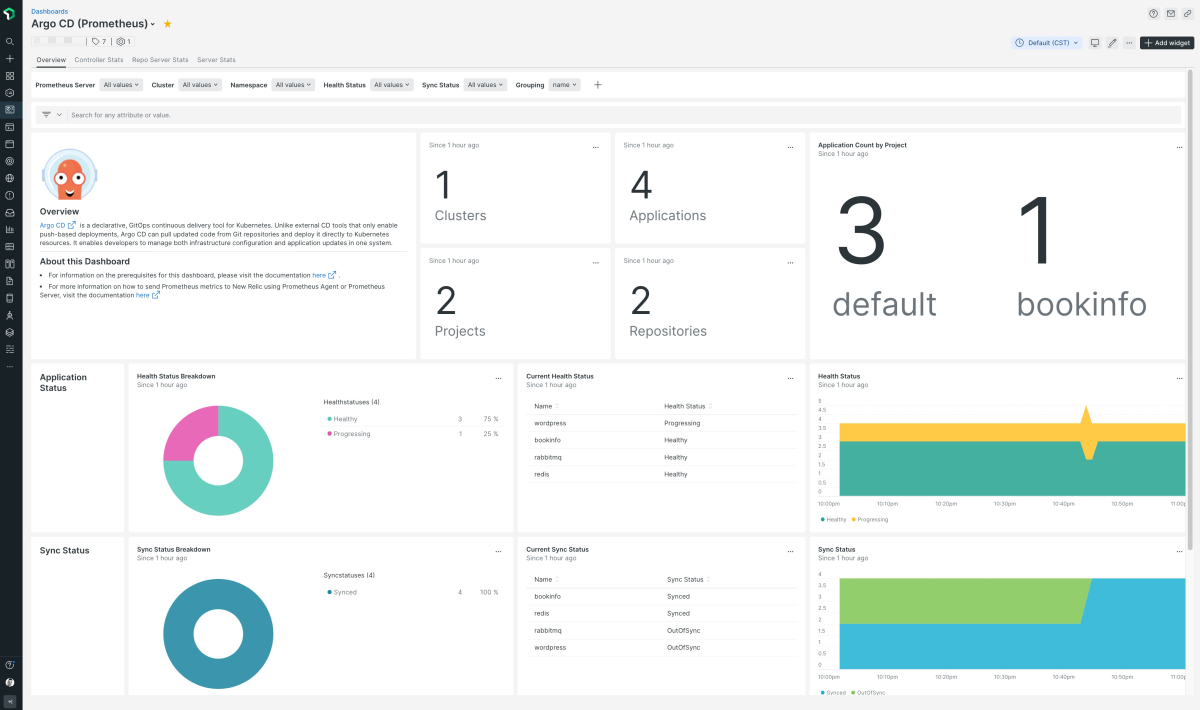
This dashboard closely mirrors the official Argo CD Grafana dashboard (Link).
Argo CD Getting started:
Argo CD Dashboard Highlights:
- Sync Activity
- Health Status
- Controller Stats
- Repo Server Stats
- Argo Server Stats
Requirements:
-
Prometheus Server or Prometheus Agent configured to remote write to New Relic.
-
Patch the Argo CD pods with
prometheus.io/scrape=truepodAnnotations. This will enable the New Relic Prometheus Integration to scrape Argo CD metrics:kubectl patch deployment argocd-server -n argocd -p '{"spec": {"template":{"metadata":{"annotations":{"prometheus.io/scrape":"true","prometheus.io/port": "8083","prometheus.io/path": "metrics"}}}} }'kubectl patch statefulset argocd-application-controller -n argocd -p '{"spec": {"template":{"metadata":{"annotations":{"prometheus.io/scrape":"true","prometheus.io/port": "8082","prometheus.io/path": "metrics"}}}} }'kubectl patch deployment argocd-repo-server -n argocd -p '{"spec": {"template":{"metadata":{"annotations":{"prometheus.io/scrape":"true","prometheus.io/port": "8084","prometheus.io/path": "metrics"}}}} }'
Need help? Visit our Support Center or check out our community forum, the Explorers Hub.


