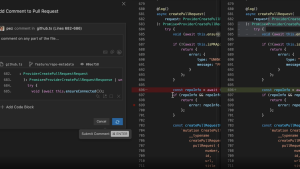
New Relic CodeStream is now available to global customers with EU data center support.
We launched New Relic CodeStream in October 2021, and now we've combined CodeStream’s productivity and observability capabilities with the functionality of our popular error tracking solution, errors inbox.
The CodeStream IDE extension seamlessly integrates with tools like GitHub and GitLab to manage pull requests, start new branches, and request code reviews from your IDE. When combined with errors inbox, you see rich error data from New Relic right in your IDE—and CodeStream automatically filters that error data based on what code is currently open in your IDE.
With New Relic CodeStream, you can streamline the way you track, prioritize, and resolve errors. You no longer need to context switch between different tools when collaborating with teammates on troubleshooting strategies or digging through logs and other performance data. With a better understanding and prioritization of errors and issues from within your code, technical teams can reduce technical debt every sprint and efficiently respond to critical errors before end-users are affected.
How to discover and resolve errors in your IDE
1. Install the CodeStream extension in your IDE (available for VS Code, Visual Studio, and JetBrains).
2. To begin receiving error data, connect to New Relic using the CodeStream quickstart integration or just select Connect to New Relic One in the Observability section of the CodeStream panel in your IDE. Then you can view any errors occurring in the services you’re currently working on, and take advantage of CodeStream dev tool integrations and collaboration features.
3. You can select an error in New Relic for additional information on the error. From there, you can navigate the stack trace and go directly to the file and line of code where the error is occurring. In this example screenshot, you can see that there's a process failure at shipping. After navigating through the call stack it’s obvious that there was a call to the billing service that resulted in an error.
4. If you want to go a bit deeper to gain even greater context on the error, you can jump directly to New Relic by selecting the error title in question.
For example, if you want to drill down into RuntimeError that was shown in the earlier step, all you need to do is select that error title and you’re taken directly to errors inbox in New Relic. You can access rich information about the individual error instance in question, such as all of the associated transaction attributes and metadata as well as surrounding logs and the aggregate measurements of when and where the error is occurring.
5. When you’ve gathered enough information in New Relic, select the Open in IDE button to get back into your code, where you can tag colleagues, comment on the line of code under review, and collaborate around a fix.
When you and your teammates have figured out and implemented a solution, you can use the error workflow management features of errors inbox to update your ticket status and mark the error as resolved.
More benefits of CodeStream
In case you haven’t discovered the other benefits of CodeStream, check out 9 ways to improve your workflow with CodeStream. It’s a powerful tool that can help you limit distractions. It also fits into your existing workflows with integrations with Jira, GitHub, and Slack.
There’s also a set of collaboration features that allow you to discuss code with your teammates right from your IDE. The discussions are saved alongside the code so that your team builds up a knowledge base over time. The knowledge base means your development team is working from an annotated codebase, which also helps new developers become productive more quickly.
And the CodeStream integration with New Relic now includes code-level metrics, a new feature that provides rich data on golden signals alongside your code. Check it out at Improve app performance with golden signals in your IDE.
Próximos pasos
Ready to use data to drive your development? Get started with the CodeStream integration today.
For a quick demo, watch this video.
Las opiniones expresadas en este blog son las del autor y no reflejan necesariamente las opiniones de New Relic. Todas las soluciones ofrecidas por el autor son específicas del entorno y no forman parte de las soluciones comerciales o el soporte ofrecido por New Relic. Únase a nosotros exclusivamente en Explorers Hub ( discus.newrelic.com ) para preguntas y asistencia relacionada con esta publicación de blog. Este blog puede contener enlaces a contenido de sitios de terceros. Al proporcionar dichos enlaces, New Relic no adopta, garantiza, aprueba ni respalda la información, las vistas o los productos disponibles en dichos sitios.


