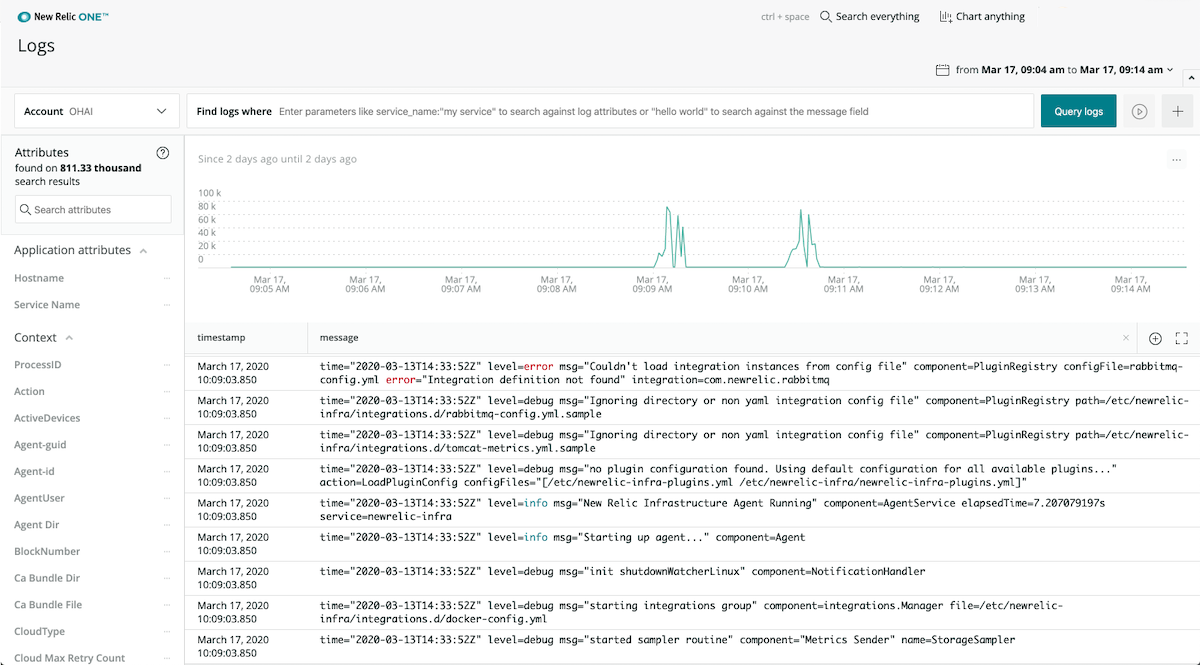
From web servers to databases to infrastructure hosts, all parts of the application stack generate log data. If they’re not careful, system admins, DevOps engineers, and developers can find themselves facing an unending torrent of logs.
As software stacks get more complex, it’s admins and developers who must sift through all that data—when debugging and troubleshooting even just one log line can help reduce mean time to resolution (MTTR). At New Relic it’s our goal to eliminate such stress and toil with a modern cloud logging solution that supports any text-based data originating on-premises or in the cloud. In pursuit of that goal—and to further enhance our observability platform—we’ve released three exciting new features that expand the capabilities of New Relic logs:
- Live tail for logs: Stream your log data in real time.
- Log forwarding from the New Relic Infrastructure agent: Eliminate the burden of managing your own log forwarder.
- Infrastructure monitoring in context: Go straight from Infrastructure dashboards to correlated logs for easy root cause analysis.
See a live tail for New Relic logs
In your day-to-day work, you almost certainly use log data to debug and troubleshoot your production environment. And often log data provides the only signal that something isn’t right; unfortunately, this data is also a trailing signal, making it difficult to reduce the time between incident and detection.
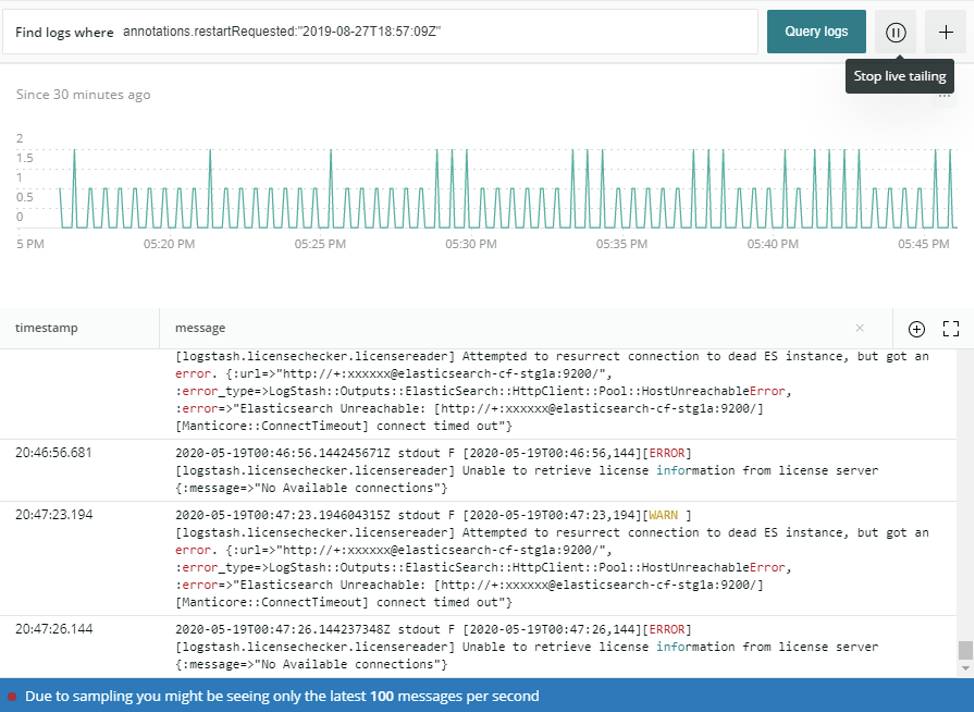
With live tail in New Relic logs, you can view your log messages as they arrive in real time. Now when you deploy a new host, server, or make other application changes, you get live log results, allowing you to immediately see how your system responds to those changes.
Enabling live tail is literally as simple as pushing a button. In New Relic logs, select Play and watch your logs stream in.

Forward logs using the Infrastructure agent
When you troubleshoot complex infrastructure issues, you often rely on a combination of metrics, events, and logs to get to the root cause. To help you speed such efforts, you can now forward logs, via FluentBit, from the Infrastructure agent.
After you enable log forwarding on the agent, you’ll be able to send logs from files, systemd-journald, Syslog, and the TCP server running on your hosts. This capability reduces the overhead and toil of managing your own log forwarder and accelerates your mean-time-to-detection (MTTD) and MTTR, as you can now draw quicker connections between your hosts’ performance and their logs.
For details on configuring log forwarding from the Infrastructure agent, as well as compatibility and requirements, see the New Relic documentation.

Get deeper observability with infrastructure monitoring in context
Logs in context leverages our infrastructure monitoring and APM metrics, dashboards and data visualizations, event correlations, and other resources to provide a complete, integrated picture of your environment.
This includes:
- Moving contextual data into the logging experience. Logs in context automatically connects with data flowing from other New Relic One components. This includes data from New Relic Infrastructure and New Relic APM, in addition to Kubernetes cluster explorer and Lambda (serverless) telemetry.
- Correlating data to reveal meaningful patterns and trends. Logs in context then correlates log messages with application, infrastructure, Kubernetes, and Lambda errors and events data—giving teams end-to-end visibility, as well as a level of depth and detail that simply isn’t available when teams work with siloed sources of log data.
- Bringing contextual attributes into logging data. Logs in context also enriches log data with high-value, contextual attributes from applications, serverless, and Kubernetes clusters. The ability to append identifiers such as a pod ID, Service Name, or Application name to logs makes it much easier to analyze this data, make useful connections, and identify other areas where an issue might affect an application’s health and performance.
To learn more about any of these features, and to see how easy it is to get started collecting, processing, exploring, visualizing, and alerting on your log data, sign up for a free demo of New Relic Logs.
Las opiniones expresadas en este blog son las del autor y no reflejan necesariamente las opiniones de New Relic. Todas las soluciones ofrecidas por el autor son específicas del entorno y no forman parte de las soluciones comerciales o el soporte ofrecido por New Relic. Únase a nosotros exclusivamente en Explorers Hub ( discus.newrelic.com ) para preguntas y asistencia relacionada con esta publicación de blog. Este blog puede contener enlaces a contenido de sitios de terceros. Al proporcionar dichos enlaces, New Relic no adopta, garantiza, aprueba ni respalda la información, las vistas o los productos disponibles en dichos sitios.


