Unraveling frontend glitches is much like decoding a mystery—each click, each user interaction can hold a clue. But what if you could play detective in the most immersive way possible? Enter New Relic session replay, now generally available (GA), placing you right into the heart of user experiences. It's an integral part of New Relic’s Digital Experience Monitoring (DEM) solution which provides a suite of integrated tools to perfect digital experiences, optimize performance and reliability, and improve customer retention, brand reputation, and revenue.
Traditional DEM tools lack the visual context of the user journey. Session Replay bridges this gap by capturing user actions, giving you a clear picture of how users navigate your website or app. This contextual understanding empowers you to identify and troubleshoot issues that traditional methods might miss. Unlike other solutions, New Relic session replay captures 100% of user actions leading to significant incidents like errors or crashes without the high cost of recording every session. With enhanced privacy controls, this tool offers replay captures for a variety of use cases such as user flow optimization and contextual customer support. Additionally, it provides the option to upgrade to extended data retention for compliance purposes. Session replay empowers you to solve problems faster and more effectively than ever before. This isn't just another debugging tool; it's your front-row seat to every user journey. Let's dive into how this tool can be your most potent ally in frontend troubleshooting. In this blog post, you'll learn to:
- Understand Session Replay
- Set up Session Replay
- Troubleshoot frontend issues
- Optimize user experience
- Contextualize customer support
Why Session Replay?
Having the right perspective is everything when we talk about troubleshooting and optimizing user experiences. Traditional debugging tools offer metrics, logs, and traces. They are invaluable, but they present a bird’s-eye view. Sometimes, you need an on-the-ground, step-by-step perspective to truly understand where things are falling short. This shift from a bird's-eye view to a full user journey empowers cross-functional teams:
- Application developers: Move from system-centric debugging to user-centric troubleshooting, ensuring solutions are both technically sound and user-friendly.
- Product managers: Gain a deeper understanding of user behavior to inform product roadmaps and prioritize features.
- UI/UX designers: Identify usability issues and optimize the user interface for a smoother experience.
- Customer support: Resolve issues faster by directly observing user actions and error encounters.
New Relic Session Replay creates a single platform for all these teams, fostering collaboration and a shared understanding of user needs. This ultimately leads to a more efficient debugging process and a product that delights users.
Setting up Session Replay
Before you can start debugging your application with Session Replay, you need to set it up.
- Start by instrumenting your application with New Relic's browser agent. This agent captures vital frontend data that Session Replay requires.
- Once instrumented, navigate to New Relic and select Browser from the side menu. Here, you’ll find the list of your instrumented applications. Select the desired application you want to set up Session Replay for.
- Click Application settings and then, under Browser settings, ensure the Session replay option is toggled on, allowing New Relic to record and replay user sessions.
- Now, configure your session parameters. Adjust the Session sample size to represent the percentage of user sessions you want to record. Modify the Sample rate of sessions with errors based on how many error-containing sessions you want to capture.
The default privacy setting masks everything by replacing all text with an *. If you need to customize what content or user input is captured, you have options to mask, block, or ignore specific classes and attributes of content or user input.
5. After setting your preferences, update the code snippet of the browser agent in your application. This ensures the agent captures your configurations accurately.
6. After a short while, once user sessions are recorded, return to New Relic. The data from these sessions will populate, letting you dive deep into each interaction.
Debug frontend errors
With the Session Replay in place, you can now monitor the user interactions to ensure every click, scroll, and interaction on your platform is error-free. Let’s dive in!
- Log in to New Relic and select your instrumented application.
- Select Errors Inbox to view a list of errors and corresponding session replays.
3. Select an error in this case “Unhandled Promise Rejection: TypeError” to drill down further
4. Now you can analyze the occurrences view and the stack trace to figure out why the error is happening.
5. If the root cause isn't immediately clear, you can watch a preview video of the user's actions leading up to the error or the full session replay by clicking on View full session replay button shown in the image above
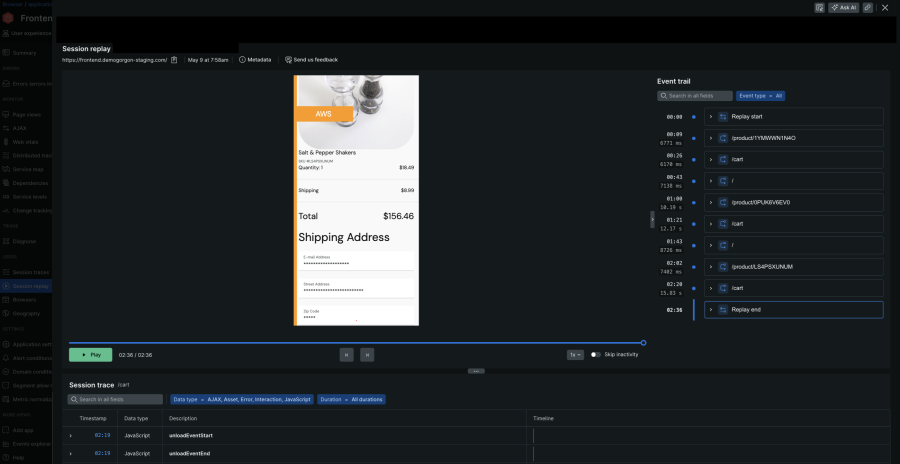
6. Now you can see all errors in the player timeline indicated by the red square icon or filter by errors in the event trail on the right. The event trail will give you important high level details such as which pages or route changes the user visited in this session.
7. Below you can see the session traces data which provides a detailed view of events firing in the Document Object Model (DOM) from seeing slow Asynchronous JavaScript and XML (AJAX) to when the LCP (largest contentful paint, which is a web vital metric) fired to where your scripts, cascading style sheets (CSS), image files, etc. loaded.
8. In this case, the "Unhandled Promise Rejection" error signals a web request gone wrong.
9. With insights from the session replay, you can now review your application's codebase. Locate the sections corresponding to the errors and make necessary corrections.
After adjustments, you can monitor subsequent sessions to confirm that the issues have been resolved.
Optimize user experience
Beyond debugging errors, Session Replay empowers you to optimize the user experience: For instance, if you are looking to improve the cart checkout flow:
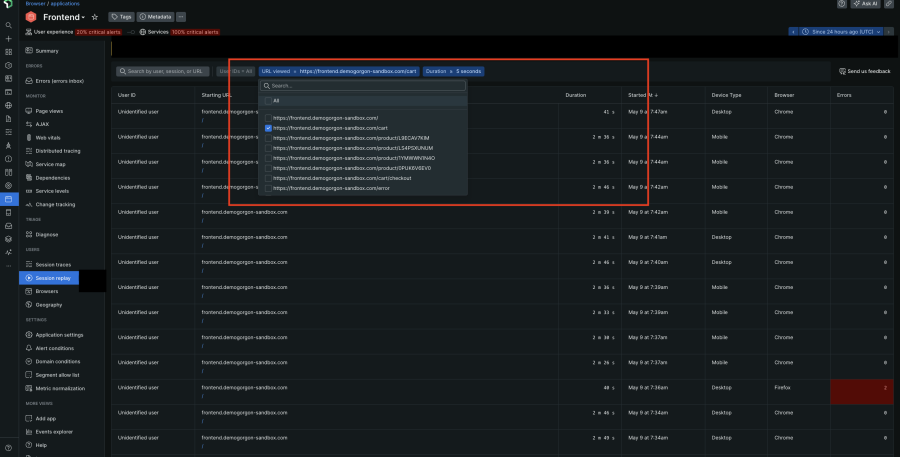
- Select the instrumented application and click on Session Replay.
- Search for the cart page using the URL filter to view relevant session replays.

3. Watch replays to understand how users interact with the page and identify areas for improvement. Perhaps a lack of guest checkout is causing cart abandonment as the users are not interested in creating an account.

Based on these observations, you can make data-driven decisions to optimize the user experience and reduce friction points in the checkout flow.
Contextualize customer support
Session Replay also provides context to customer support teams to resolve issues efficiently:
- Search by the specific user to identify their specific session within Session Replay.

2. Playback the recording to see exactly what the user was doing that led to the error.
With a clear understanding of the problem, the agent can now directly assist the customer. They can explain why the error occurred, offer a solution or escalate the issue to the development team if it's a website bug. This eliminates the need for back-and-forth communication and gets the customer back on track
Conclusion
New Relic Session Replay empowers you to see your application through the user's eyes. In this blog, we've walked you through the setup process and shown you how to actively debug frontend issues, optimize user flow and contextualize customer support using session replay. By proactively identifying pain points and optimizing user journey, you can create a web experience that keeps your users happy and coming back for more.
Get started with Session Replay today and unlock the secrets to a better web experience!
Próximos pasos
Ready to dive deep into debugging? Experience the power of New Relic Session Replay firsthand. Sign up today and unlock the tool's potential for your application. Best part? It's free!
Las opiniones expresadas en este blog son las del autor y no reflejan necesariamente las opiniones de New Relic. Todas las soluciones ofrecidas por el autor son específicas del entorno y no forman parte de las soluciones comerciales o el soporte ofrecido por New Relic. Únase a nosotros exclusivamente en Explorers Hub ( discus.newrelic.com ) para preguntas y asistencia relacionada con esta publicación de blog. Este blog puede contener enlaces a contenido de sitios de terceros. Al proporcionar dichos enlaces, New Relic no adopta, garantiza, aprueba ni respalda la información, las vistas o los productos disponibles en dichos sitios.


