Any developer building on serverless architecture knows that AWS Lambda functions don’t exist in a vacuum.
In fact, serverless functions almost always tend to be small, yet critical, parts of an overall event-driven architecture, serving as the glue for business logic between other managed services.
As applications grow in complexity, getting instant visibility into which service triggered an AWS Lambda function invocation—and the context surrounding that call—is crucial towards building observability into your serverless applications.
When something goes wrong, how quickly are developers able to identify whether an event source configuration upstream or connecting service is causing the issue?
To address this challenge, we recently released event sources for Node.js and Python as part of New Relic Serverless for AWS Lambda. Users can now instantly receive valuable context about AWS Services that trigger each invocation within your serverless application.
Our new event sources feature also displays metrics such as duration, invocation counts, errors, external calls, and last occurrence all scoped down to the specific AWS service triggering an AWS Lambda Function.
Event Sources In Action
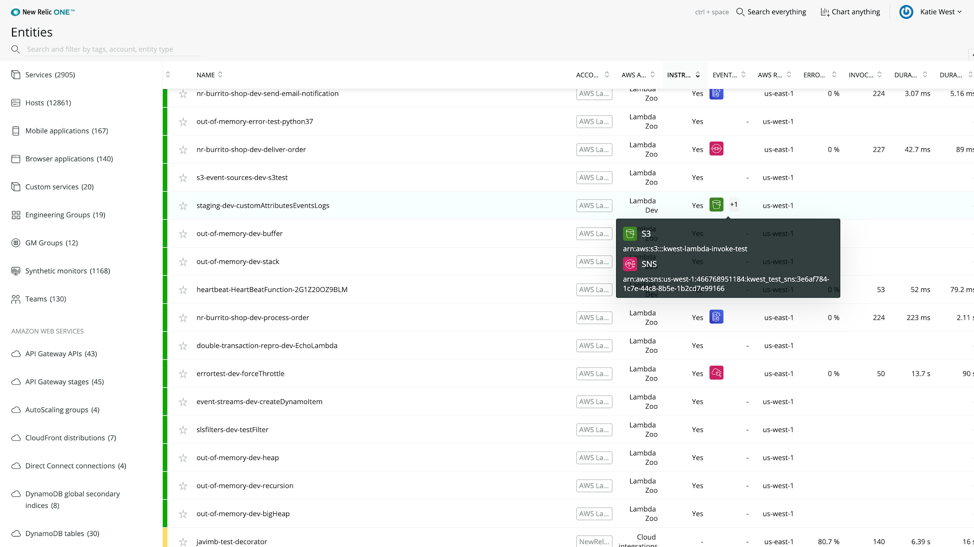
When viewing Lambda functions in New Relic One’s entity explorer, users can instantly see icons with tooltips showing exactly the AWS service currently triggering each function. This quickly gives developers context into what type of data each function is processing. In the example below, we can see that this particular function is being triggered by both S3 and SNS.
API Gateway as an Event Source
Now, let’s take a closer look at a function being triggered by API Gateway—one of the most common event sources for AWS Lambda functions. Unfortunately, this is also the point where developers often lose transparency.
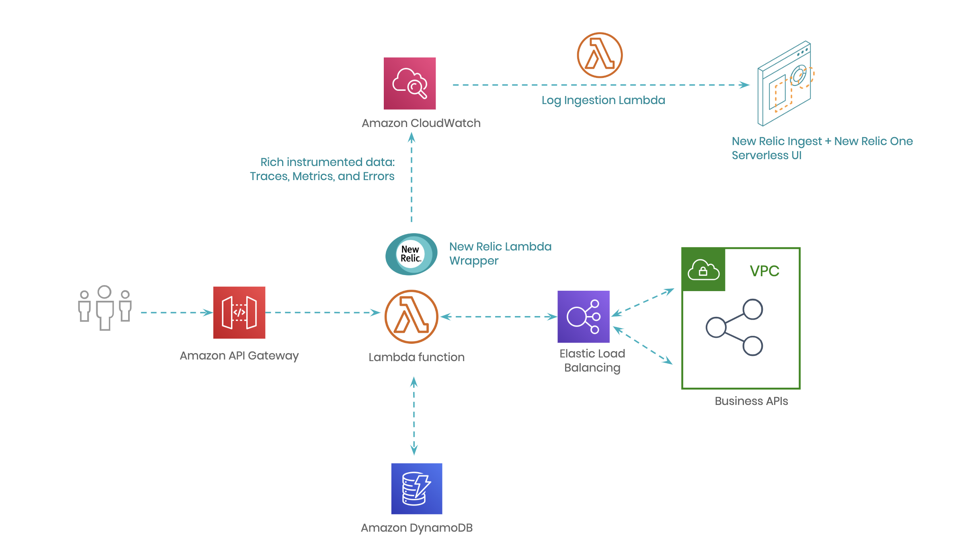
For example, in a simple, serverless application (like the below example), API Gateway triggers a Lambda function whenever a user interacts with an application (examples: orders a retail item, views a media format, requests shipping notification, etc.), which then connects to other business APIs and databases.
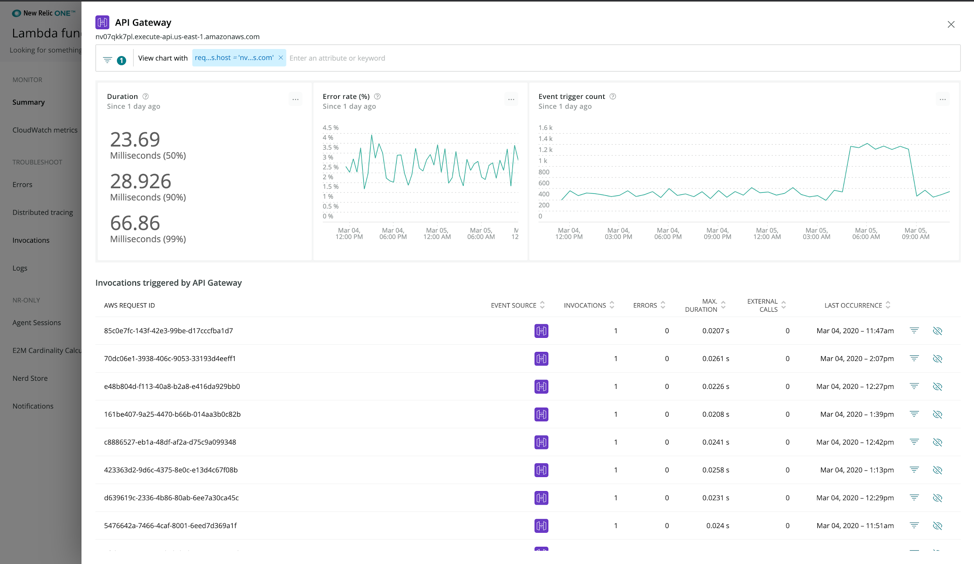
When viewing a single function, we can see the exact AWS service that triggered this function, and how often it was invoked. If multiple services are triggering the function, they will be listed on the right side of the user interface.
With a single click, the function can be filtered down to the exact event source to find correlations in metrics such as cold starts, errors, and duration percentiles.
As shown below, you can also click to view all invocations filtered to the specific event source that you’re examining:
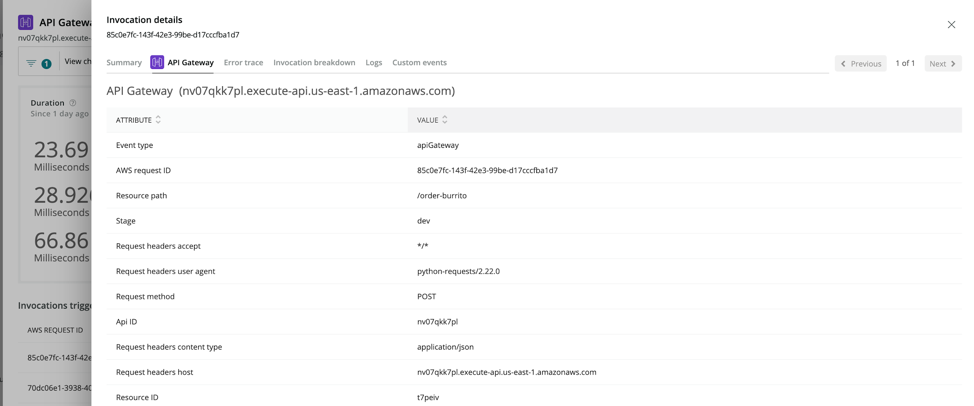
When viewing an individual invocation, there’s now a new tab with context around the specific event trigger for the invocation. All of these attributes are automatically collected by the New Relic Lambda Layer:
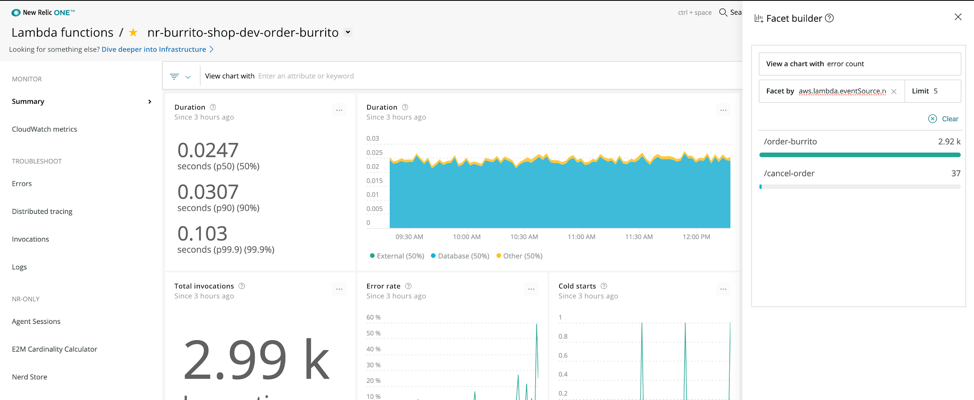
Need to do a deeper analysis? You can filter and facet by any of these attributes throughout different views in New Relic One, including using the new Facet Builder (more on that below) to quickly generate charts with metrics faceted to event trigger attributes. In the example below, we can quickly see that the /order-burrito API Gateway resource path has the most errors:
How to start debugging AWS Lambda Event Sources:
This feature is included as part of New Relic One and is now available on both our Serverless Pro Plan and Free Trial tiers.
Existing users will need to update to the latest version of the New Relic log ingestion function and update the CloudWatch Subscription Filters using the latest version CLI installer or AWS SAM by following our upgrade documentation here.
Once updated, event source info will be visible across New Relic One, including the function overview, invocation detail view, and the entity explorer.
Initial supported event sources include:
- ALB
- API Gateway
- CloudFront
- CloudWatch Scheduled
- DynamoDB Streams
- Firehose
- Kinesis
- S3
- SES
- SNS
- SQS
To see event sources in action, update to the latest New Relic Serverless version.
What else is new in New Relic Serverless?
Based on user feedback, we’ve added several new features to help developers function faster on AWS Lambda.
- Logs in context for serverless
Switching between monitoring metrics and logs is a major time drain when trying to troubleshoot serverless applications. Logs in context now enables users to instantly correlate metrics such as errors, duration, and cold starts— as well as traces—to related invocation logs.
We retrieve information from your AWS entities, which gives you the ability to filter and facet down to the team or specific metadata attributes on the function configuration or invocation itself.For example, if a user identifies a problematic Lambda invocation, they can select logs for that particular invocation and instantly see the associated log data. Available throughout the user interface, the new feature makes it easier to drill down to the root cause of an issue in a single experience: In addition, function level logs are also available, so developers can get a live tail of a function log with a single click to more quickly debug function development.
 - Facet Builder: Explore custom insights without having to write queries
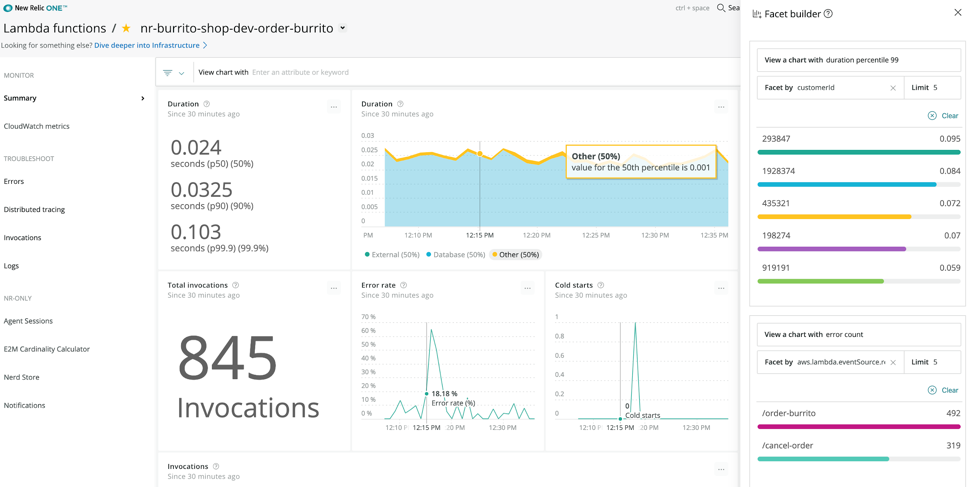
New Relic’s Facet Builder for AWS Lambda instantly facets your dashboards and charts by attribute and metric to explore custom insights—without having to write queries. Now available on the summary, errors, and invocations dashboard for all New Relic Serverless users:
-
- Bulk CLI Installer: Instrument all of your functions with a single command with zero code changes
For enterprises running thousands of AWS Lambda functions, monitoring updates often requires a script or a ton of manual work. New Relic’s CLI installer now lets developers instrument or update all of their Node.js or Python functions in a single command. Learn more here.
- Bulk CLI Installer: Instrument all of your functions with a single command with zero code changes
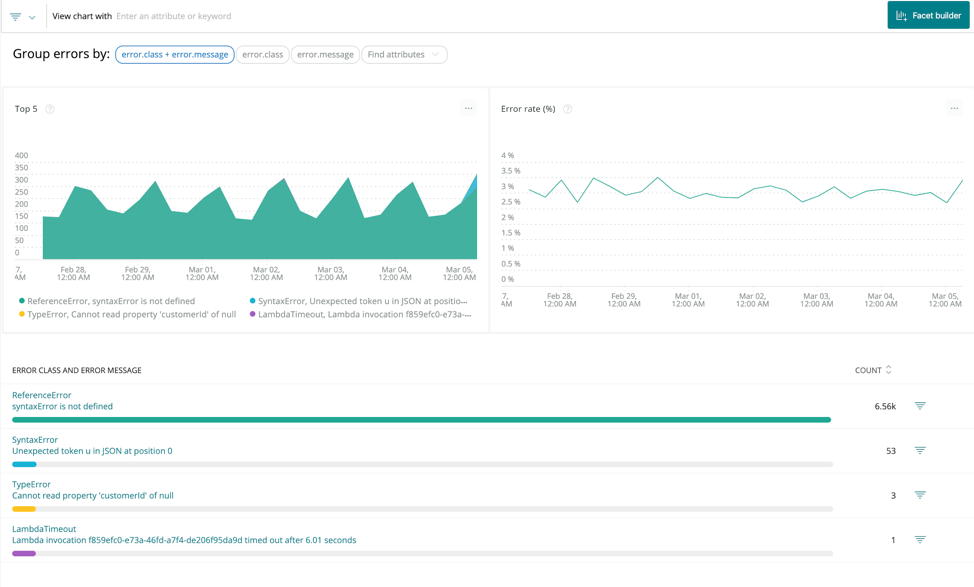
- Timeout and Out of Memory Error Synthesis Timeouts and out of memory errors in Lambda can often be difficult to identify and pinpoint. New Relic Serverless for AWS Lambda now automatically analyzes log data and synthesizes error events and invocations for those that were interrupted unexpectedly, including timeout and out of memory incidents. Debuggers can now quickly spot such failures while viewing errors and invocations for AWS Lambda functions:
Learn more about our new features or get started on your free trial of New Relic Serverless Monitoring for AWS Lambda.
Las opiniones expresadas en este blog son las del autor y no reflejan necesariamente las opiniones de New Relic. Todas las soluciones ofrecidas por el autor son específicas del entorno y no forman parte de las soluciones comerciales o el soporte ofrecido por New Relic. Únase a nosotros exclusivamente en Explorers Hub ( discus.newrelic.com ) para preguntas y asistencia relacionada con esta publicación de blog. Este blog puede contener enlaces a contenido de sitios de terceros. Al proporcionar dichos enlaces, New Relic no adopta, garantiza, aprueba ni respalda la información, las vistas o los productos disponibles en dichos sitios.

