Quickstart
NService Bus
NServiceBus is a messaging system for service-oriented backend architectures. It is specifically designed for .NET applications, and it implements a Pub/Sub brokering system, along with many other features, that make handling service messaging simple and intuitive. However, backend architectures are complicated, with many interacting services and processes, so it is not unusual for messages to get dropped or corrupted in some way.
The New Relic complete monitoring quickstart provides insight into all aspects of the NServiceBus application runtime, saving users from countless headaches that could arise when working with the system.
New Relic NServiceBus quickstart features
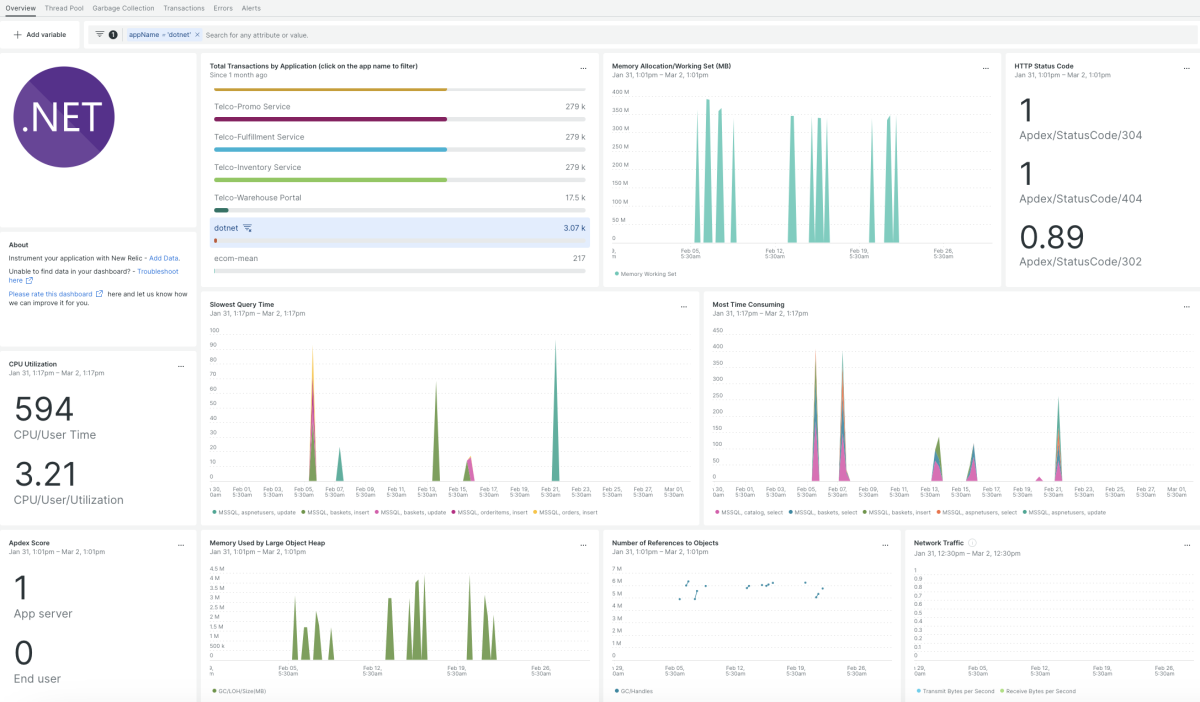
The New Relic NServiceBus Quickstart comes packaged with numerous features that ensure the health of the NServiceBus application. They are broken down into two categories. Dashboards, which provide visual insight into application performance, and Alerts, which notify developers when a potential issue arises within NServiceBus.
Dashboards include the following
- Transactions overview which gives an overview of all messaging transactions passing through NServiceBus
- Errors overview documenting errors occurring within the system and their potential origins
- VM overview which reports key VM utilization statistics such as memory and CPU usage
- Top 10 failed transactions shares the highest impact failed transactions which are causing a backend to lag
- Latest error report has the most recent error so that it can be immediately addressed
- And more…
Alerts include
- Apdex score updates you when the apdex score, i.e. the ratio of satisfied/successful requests to total requests, falls below a certain threshold
- Memory usage sends an alert when RAM usage exceeds a pre-set threshold
- Transactions error alerts the user when transaction errors climb past a certain level
New Relic - the ideal NServiceBus monitoring tool
New Relic’s quickstart provides the ultimate in NServiceBus monitoring solutions. Having continual insight into NServiceBus performance is key to ensuring that backend systems run smoothly with consistent uptime, as messaging is a huge point of failure for backend architectures. When messages are not transacted successfully, communication between backend services breaks down leaving the application unable to function successfully as a whole.
By providing dashboard insight into the apdex score and commonly failed transactions, and alerts which notify the user prior to reaching critical thresholds, the New Relic quickstart allows weak points in the system to be identified immediately, before communication in the backend fails completely.
Similarly, proper management of the NServiceBus VM is critical to ensuring that the NServiceBus application itself doesn’t crash completely. The New Relic dashboards and alerts provide continual VM monitoring, allowing developers to make key decisions regarding throttling and other performance constraints when usage gets too high.
Need help? Visit our Support Center or check out our community forum, the Explorers Hub.

