New Relic Now Start training on Intelligent Observability February 25th.
Save your seat.
No momento, esta página está disponível apenas em inglês.
 / 
NGINX Ingress Controller (Prometheus)

NGINX Ingress Controller (Prometheus)

Visualize NGINX ingress controller performance and alert on potential configuration errors. Download New Relic NGINX ingress controller quickstart to increase visibility into your ingress performance. This quickstart is based on metrics sent to New Relic using Prometheus Agent or Prometheus Server.

What's included?

dashboards
1
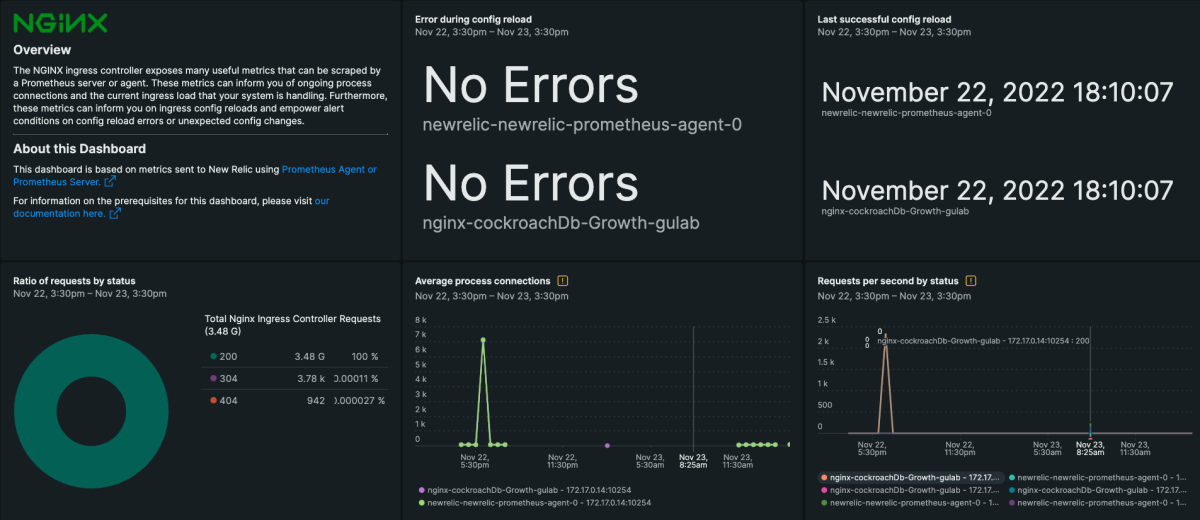
NGINX Ingress Controller (Prometheus) quickstart contains 1 dashboard. These interactive visualizations let you easily explore your data, understand context, and resolve problems faster.
alerts
4
NGINX Ingress Controller (Prometheus) observability quickstart contains 4 alerts. These alerts detect changes in key performance metrics. Integrate these alerts with your favorite tools (like Slack, PagerDuty, etc.) and New Relic will let you know when something needs your attention.
Nginx-ingress config load errors alert
This alert is triggered when there is an error loading ingress configuration
Ingress certificate expiration alert
This alert is triggered when there are less than 30 days remaining for certificate expiration. The alert threshold can be changed to your desired expiration alerting requirements.
P99 latency alert
This sample alert is triggered when the controller request processing duration for the 99th percentile of requests goes above 100 ms. The alert threshold can be changed to your desired latency for alerting requirements.
High HTTP 4xx/5xx error alert
This alert is triggered when the HTTP request success rate drops below 95 percent. The alert threshold can be changed to your desired error alerting requirements.
documentation
2
NGINX Ingress Controller (Prometheus) observability quickstart contains 2 documentation reference. This is how you'll get your data into New Relic.

Why monitor the NGINX ingress controller?

The NGINX ingress controller exposes many useful metrics that can be scraped by a Prometheus server or agent. These metrics can inform you of ongoing process connections and the current ingress load that your system is handling. Furthermore, these metrics can inform you on ingress config reloads and empower alert conditions on config reload errors or unexpected config changes.

NGINX ingress controller quickstart highlights

  • Config reload monitoring (errors and last successful reload)
  • Throughput faceted by ingress classes
  • Request/response insights on payload size and response time
  • CPU and memory statistics
  • This quickstart is based on metrics sent to New Relic using Prometheus Agent or Prometheus Server.

Monitoring NGINX ingress controller

The NGINX ingress controller has to have metrics enabled before they are available to be scraped. Instructions for ensuring your NGINX metrics are enabled can be found here: https://kubernetes.github.io/ingress-nginx/user-guide/monitoring/#wildcard-ingresses

How to use this quickstart

  • Sign Up for a free New Relic account or Log In to your existing account.
  • Click the install button.
  • Install the quickstart to get started or improve how you monitor your environment. They're filled with pre-built resources like dashboards, instrumentation, and alerts.
Authors
New Relic
Zack Mutchler
Gulab Sidhwani
Support
BUILT BY NEW RELIC
Need help? Visit our Support Center or check out our community forum, the Explorers Hub.