Trying to guess what can go wrong with application security no longer works in a complex system of various technologies, microservices, and libraries. If one part fails, it can topple the entire system. But with the Lacework Integration quickstart, security is a data-driven activity. You can detect deviations from the norm in your system and then address them.
I used to be nervous about security. It never felt like something I could make sense of or visualize. But collaborating with Lacework these past few months taught me that it by no means needs to be scary! They’ve made the process of detecting security anomalies quite painless and I’m excited to learn more as our partnership with them evolves.
At the Uncovering Security Anomalies in the Cloud session at Data Nerd Days 2.0 on November 3, Adam Larson walked through various use cases and explored how to read and analyze compliance violations and security anomalies. You can watch Adam's video, review the steps in this blog post, and try out the pre-built dashboards in the quickstart at any time.
The complex world of security
As enterprise applications shifted to the cloud, containerization and DevOps made security a much more challenging and complex job than it’s ever been before. There’s a lot of new surface area, and many more humans are involved who have access to keys and secrets but might not necessarily understand security.
Security professionals are still responsible for all the same things: securing company systems and software, and making sense of security breaches.
But today, there are so many new things they also need to worry about. There are more people doing nefarious and risky things, and there simply isn’t an industry-accepted solution for all of these challenges.
Security in the past, way back in 2010
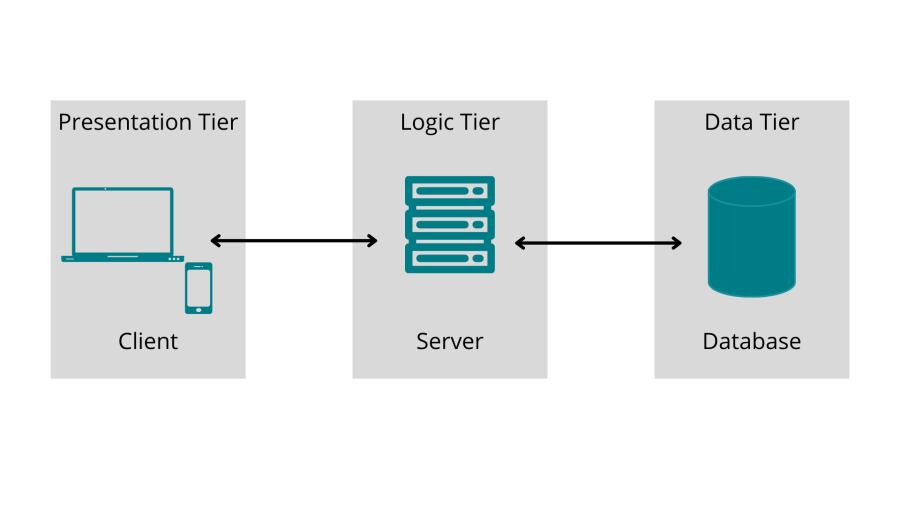
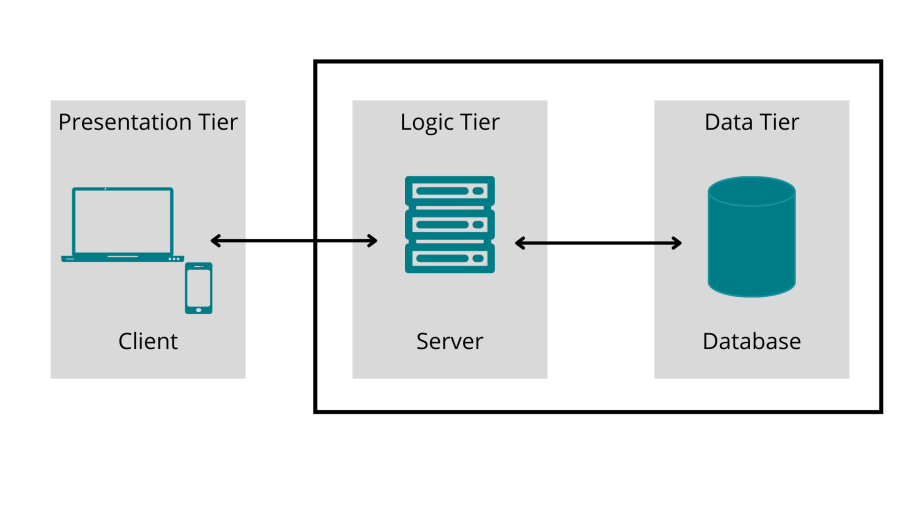
The majority of application architecture looked like this in 2010:

There was some JavaScript, the back end, and then some data. For the most part, security drew a box around the right two.

Cut to today: Challenges with complexity and dependencies
Check out this image from the Cloud Native Computing Foundation (CNCF) of the CNCF Cloud Native Interactive Landscape, which encompasses all of the different technology components that are just within the CNCF.
Cloud Native Computing Foundation (CNCF) Landscape map from landscape.cncf.io.
These days, in addition to the traditional risks, security professionals also need to account for all of these technologies too!
It’s impractical to deeply understand every single thing in this image. But 70% of modern breaches today are attributed to misconfiguration or essentially “leaving the door open” from a security standpoint, according to The Biggest Cloud Breaches of 2019 and How to Avoid them for 2020. Why? It’s the same challenge. Who could reasonably be expected to protect all of these different technologies?
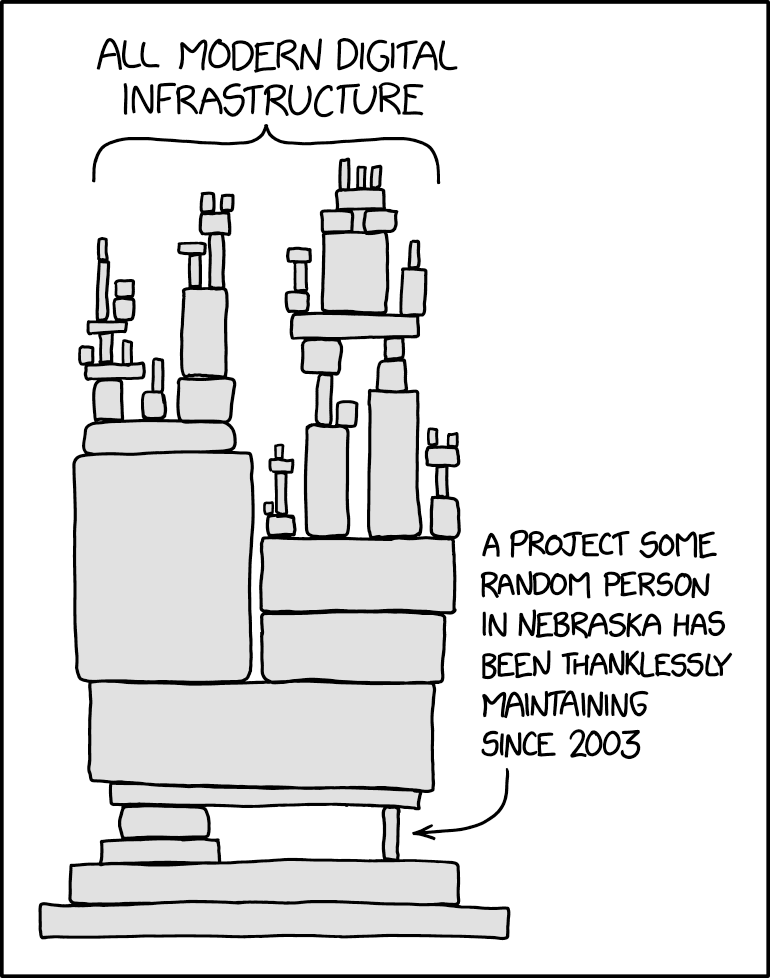
As Adam showed in his Data Nerd Days presentation, this Dependency illustration from xkcd is most likely an accurate representation of most companies' application architecture.

Illustration from https://xkcd.com/2347/.
You’re probably interacting with a precariously balanced system of microservices and libraries, many of which you and your team understand—but perhaps no one else at your company has intimate knowledge about them. At any point, if one fails, it can topple the system in a very real way from a security standpoint.
With the rise of open-source software and third-party libraries, it’s nearly impossible to keep up with every security issue. You might not know who wrote the code running in production. And you might not know the risks associated with it.
A lot of security tools of the past have tried to guess what can go wrong. You had to think like an attacker about what holes existed in the system to preemptively patch them. But that's not a viable solution anymore, thanks to all of these new technologies.
Lacework’s solution
With Lacework, you can pay attention to the anomalies instead of taking a rules-based approach where you have to write out all the rules you want to check. Lacework takes a baseline of what every application, person, and account normally does: which machines talk to each other, what users do when they log in, and what actions they most often take.
Instead of trying to predict what's going to go wrong, and inevitably missing things, you can detect any worrisome deviations from the norm in your system. With Lacework, you can use data to improve security.
Use the Lacework integration with New Relic
Lacework was one of the first partners to build a quickstart in New Relic Instant Observability (I/O), tackling this security observability use case— and bridging the gap between observability and security teams. New Relic I/O is an open-source catalog of more than 400 pre-built dashboards, alert configurations, and guides that you can quickly and easily install in your New Relic platform.
The Lacework quickstart integrates with New Relic’s database to surface security events and alerts directly in New Relic One. All it takes is one click to install three dashboards and a data source. The interactive visualizations on the dashboards show anomaly detections, compliance violations, and a high-level security overview of your systems. You use the data source to get the data into New Relic. With these dashboards, you can easily explore your data, understand context, and resolve problems more quickly.
Let's say that your application slows down and anomalies are showing in your New Relic dashboard. There are a lot of reasons why that could happen. Many are probably routine and benign, but some might be security issues. New Relic notifies you that the issue has occurred, and together with Lacework, you can investigate whether or not it was because of a security breach.
The partnership between New Relic and Lacework is incredibly powerful for use cases where you find something malicious that could pose a security risk. Bringing these curated security alerts into the New Relic platform means you can easily triage against your wealth of observability data. It's easy to transition from monitoring to security investigations from one place.
Here's what it takes to set up this partnership:
- Make sure you have set up New Relic One and Lacework individually.
- Plumb the Lacework anomaly and prevention detections into the New Relic database. See the Lacework documentation about forwarding alerts to New Relic using the Insights API.
- Install the Lacework Integration quickstart:
- Sign up for a free New Relic account or log In to your existing account.
- On the Lacework Integration quickstart page, click the + Install quickstart button.
When you install the Lacework quickstart, you automatically get three pre-curated dashboards where you can perform your initial security triage directly from New Relic:
- Lacework Security Overview
- Lacework Anomaly Detections
- Lacework Prevention Detections
Próximos passos
Now that you learned how to read and analyze the compliance violations and security anomalies that Lacework and New Relic help you detect, you can try it yourself. Install the quickstart and uncover security anomalies in your cloud applications.
As opiniões expressas neste blog são de responsabilidade do autor e não refletem necessariamente as opiniões da New Relic. Todas as soluções oferecidas pelo autor são específicas do ambiente e não fazem parte das soluções comerciais ou do suporte oferecido pela New Relic. Junte-se a nós exclusivamente no Explorers Hub ( discuss.newrelic.com ) para perguntas e suporte relacionados a esta postagem do blog. Este blog pode conter links para conteúdo de sites de terceiros. Ao fornecer esses links, a New Relic não adota, garante, aprova ou endossa as informações, visualizações ou produtos disponíveis em tais sites.


