At Car IQ, we deal with real-time financial transactions: our customers are real drivers waiting at the petrol pump to pay and dispense fuel utilizing our services. Any disruptions can have serious impacts on the driver’s ability to complete their work on time. As a customer obsessed tech company, it’s paramount that we become aware of problems within our workflow the instant they happen. Not only so that we can confirm/fix them, but also so that we can proactively reach out to the customer and let them know we are aware of the issue—even in cases where transactions fail due to user error (daily limits, spend rules, proximity, etc).
From an infrastructure perspective, we wanted to get to a place where
- We become aware of problems the instant they happen—not when a customer reports issues.
- Any alerting would be intelligent enough to give us suggestions on a fix/help identifying the root cause.
In order to get there, we made use of the following
- Dashboards with distributed tracing agents
- Alerts
- Synthetic monitoring
Before implementing New Relic across our operations, addressing critical incidents was sometimes a weekly occurrence. With a distributed, cloud-based architecture, digging into root causes was definitely a challenge at times. Figuring out why a transaction failed in an unusual way involved multiple log windows, timestamp matching, and sometimes even manual db lookups—it was more or less a game of deductive reasoning. Not only did this increase our mean time to recovery (MTTR), but also put strain on customer relationships and disrupted developers’ workflows.
1. Dashboards for our infra and operations
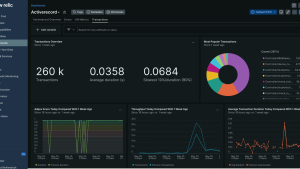
Have you ever walked into a room you’re very familiar with and could instantly tell that something was out of place? That’s what dashboards do for us—a familiar high level view of the historical and current performance of our infrastructure. If something is out of whack, we can tell almost immediately. Having visualizations that let us see the health of our infrastructure at any given moment helps us keep an eye on our operations and find ways to maintain high efficiency by addressing performance drops as they occur. When setting up our oversight dashboards, we drew on the dashboard wizard features that come out of the box with New Relic.
Entering environmental variables and sharing API keys was enough to provide us with instant oversight of our infrastructure via dashboards in less than twenty minutes. We could set up custom attributes and event types to show specific details we wanted to monitor.
Our dashboards act as a user interface. We can click on a transaction and see its journey through all of our services. Distributed tracing capabilities are an essential element of our dashboard views: we set up New Relic agents on our microservices that automatically inject trace IDs into our transactions. This allows us to investigate issues and determine root causes without having to query other teams for transaction data or logs. We also did some training for teams on the benefit of distributed tracing and how to dig further into metrics with errors inbox.
2. Finely-tuned alerts for easy prioritization
To address issues throughout the day, as soon as they start occurring, we set up alerts.
One challenge with alerts is mitigating alert fatigue: an abundance of unactionable messages, as thresholds are set too low or too broad. They inform you of any slight glitch which has evened out or resolved itself before you need to look into it. The first thing we did when implementing New Relic, was fine-tune our alert thresholds.
When fine-tuning alerts, it is important to identify the thresholds that lead to action: make your alerts actionable to ensure they have value when being reported. This cut down on a lot of our reporting quickly and allowed us to focus on the true errors and infrastructure issues as they surfaced.
On our dashboards, we set thresholds and defined the alert conditions and how we wanted those alerts to be communicated to our teams. For example, we set an alert for any time the error rate on one of our servers was greater than five in a two-minute period. And we used New Relic’s in-built integrations to link the alerts directly to our DevOps Slack channel.
3. Synthetic monitoring: Regular spot checks across our systems
Like any company with APIs, a distributed architecture, and massive cloud infrastructure, it is absolutely vital to perform regular checks. This needs to go beyond health checks: hitting an endpoint and returning a 200 response is one thing, but how do you validate the integrity of your data? How can you validate running an end-to-end test in production every minute, every two minutes, every five minutes, and know the second that something doesn't work as expected? Employing synthetic monitoring best practices allows us to run additional testing scenarios and ensure our real-time data systems are robust and performant around the clock. With dashboards that allow distributed tracing and finely tuned alerts in place, our final component was installing synthetic monitoring health checks.
Automated DevOps: A business gamechanger
In the last six months, our backlog of DevOps issues have cleared up, we have been able to tweak our infrastructure, and reduce overall cloud costs. This has changed our relationship with the CTO and engineering teams across the business. Now we have a lot of forward thinking conversations. We are focused on the product and what features we’re launching, with less time spent on fighting fires with a much greater focus on delivery. Engineering team delivery rates have gone up at least 50%. We're launching things all the time and are using the extra time to grow out strategic partnerships and integrations.
Businesses like ours need to move away from manually obsessing over the quality of our infrastructure and the ability to track the flow of transactions and user experience: our systems should be automated enough to tell us what is going on and help us keep on top of where we can make an impact. High performant, robust and reliable infrastructure are table stakes for our future market growth.
As opiniões expressas neste blog são de responsabilidade do autor e não refletem necessariamente as opiniões da New Relic. Todas as soluções oferecidas pelo autor são específicas do ambiente e não fazem parte das soluções comerciais ou do suporte oferecido pela New Relic. Junte-se a nós exclusivamente no Explorers Hub ( discuss.newrelic.com ) para perguntas e suporte relacionados a esta postagem do blog. Este blog pode conter links para conteúdo de sites de terceiros. Ao fornecer esses links, a New Relic não adota, garante, aprova ou endossa as informações, visualizações ou produtos disponíveis em tais sites.


