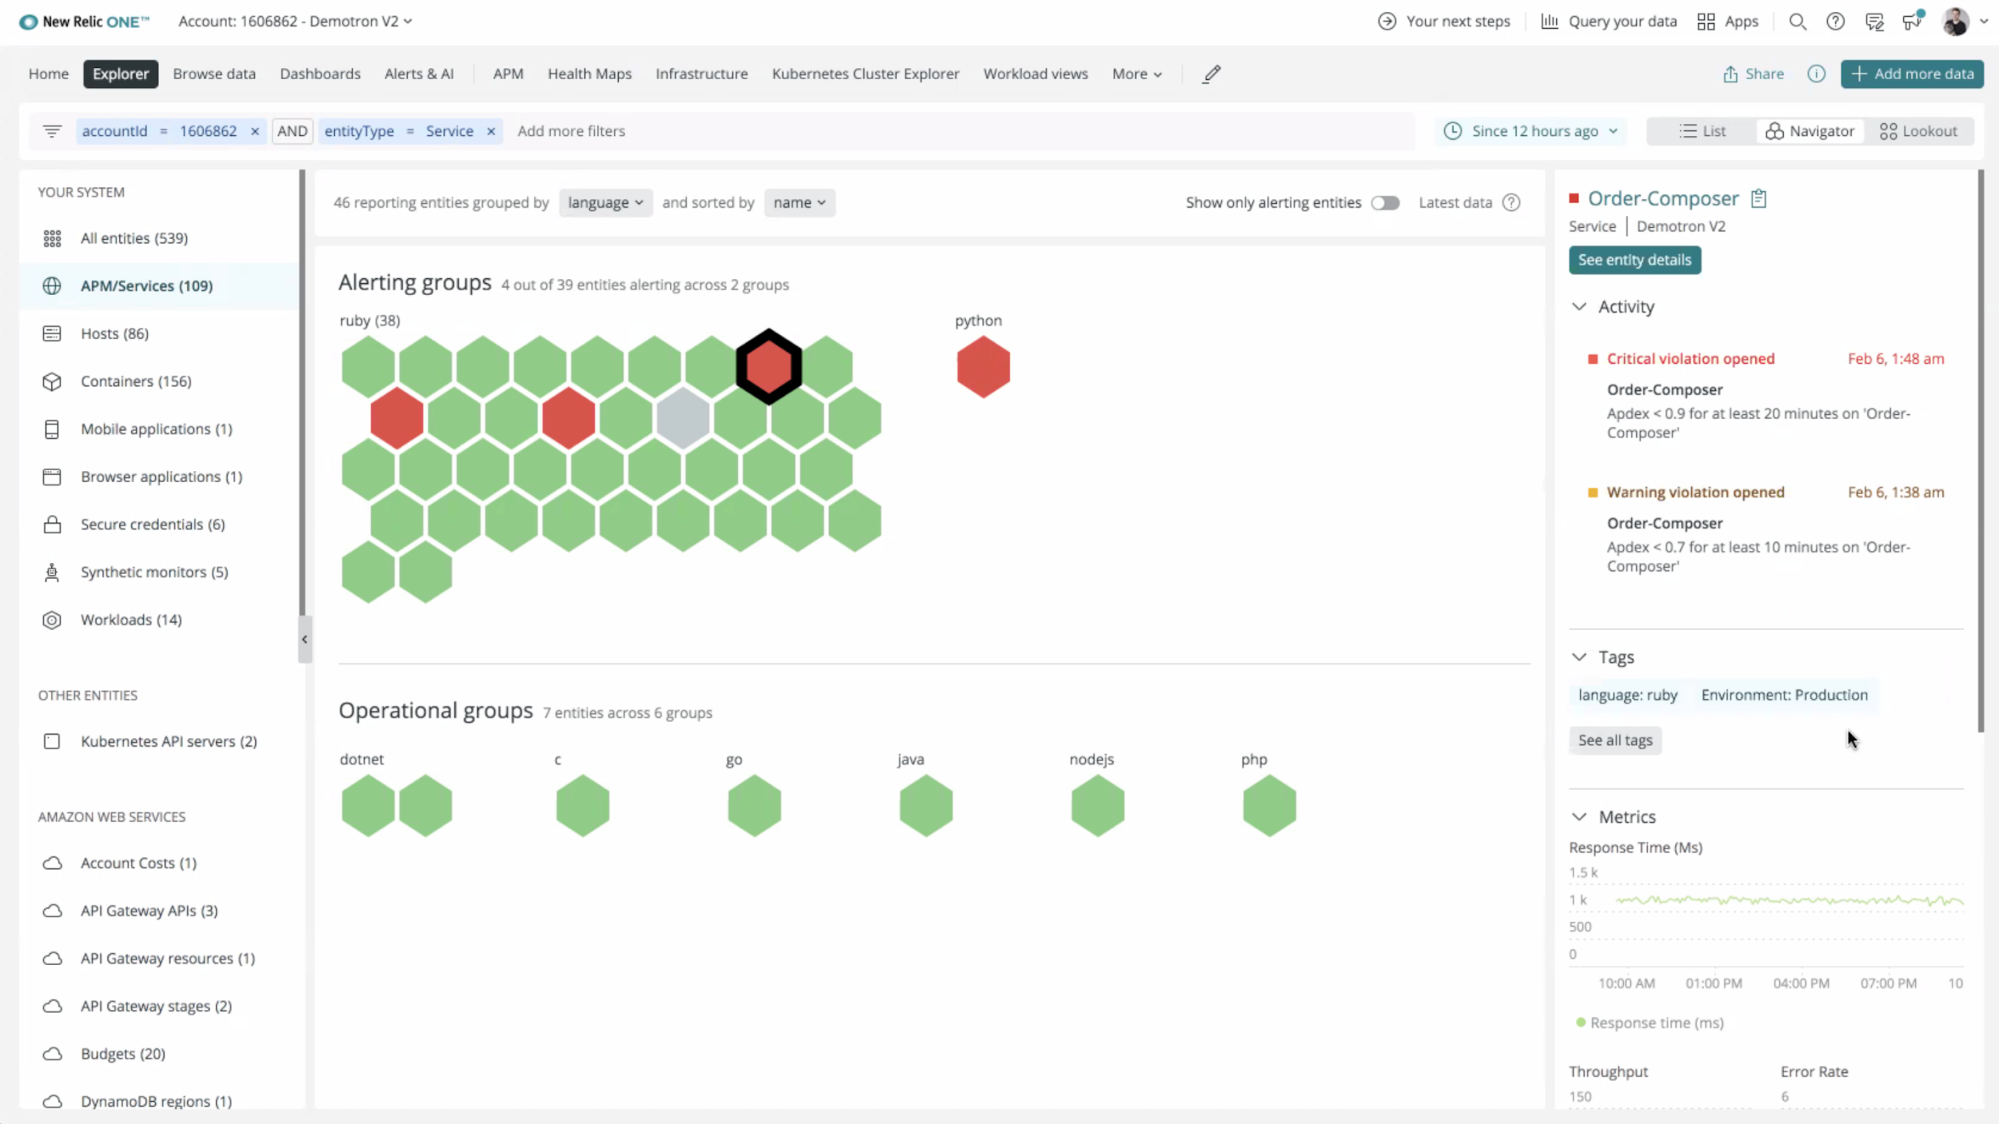
In the modern microservice world, we all have more hosts, services, and containers running than any person can easily keep track of. In our latest Nerdlog we explore how New Relic Navigator can show you all your hosts, containers, and applications in a single view, without exercising your scroll wheel.
Matthew Demyttenaere, Product Manager on the New Relic Navigator, shares how every user has access to a new high-powered view that gives real insight into your whole stack, all from a single view.

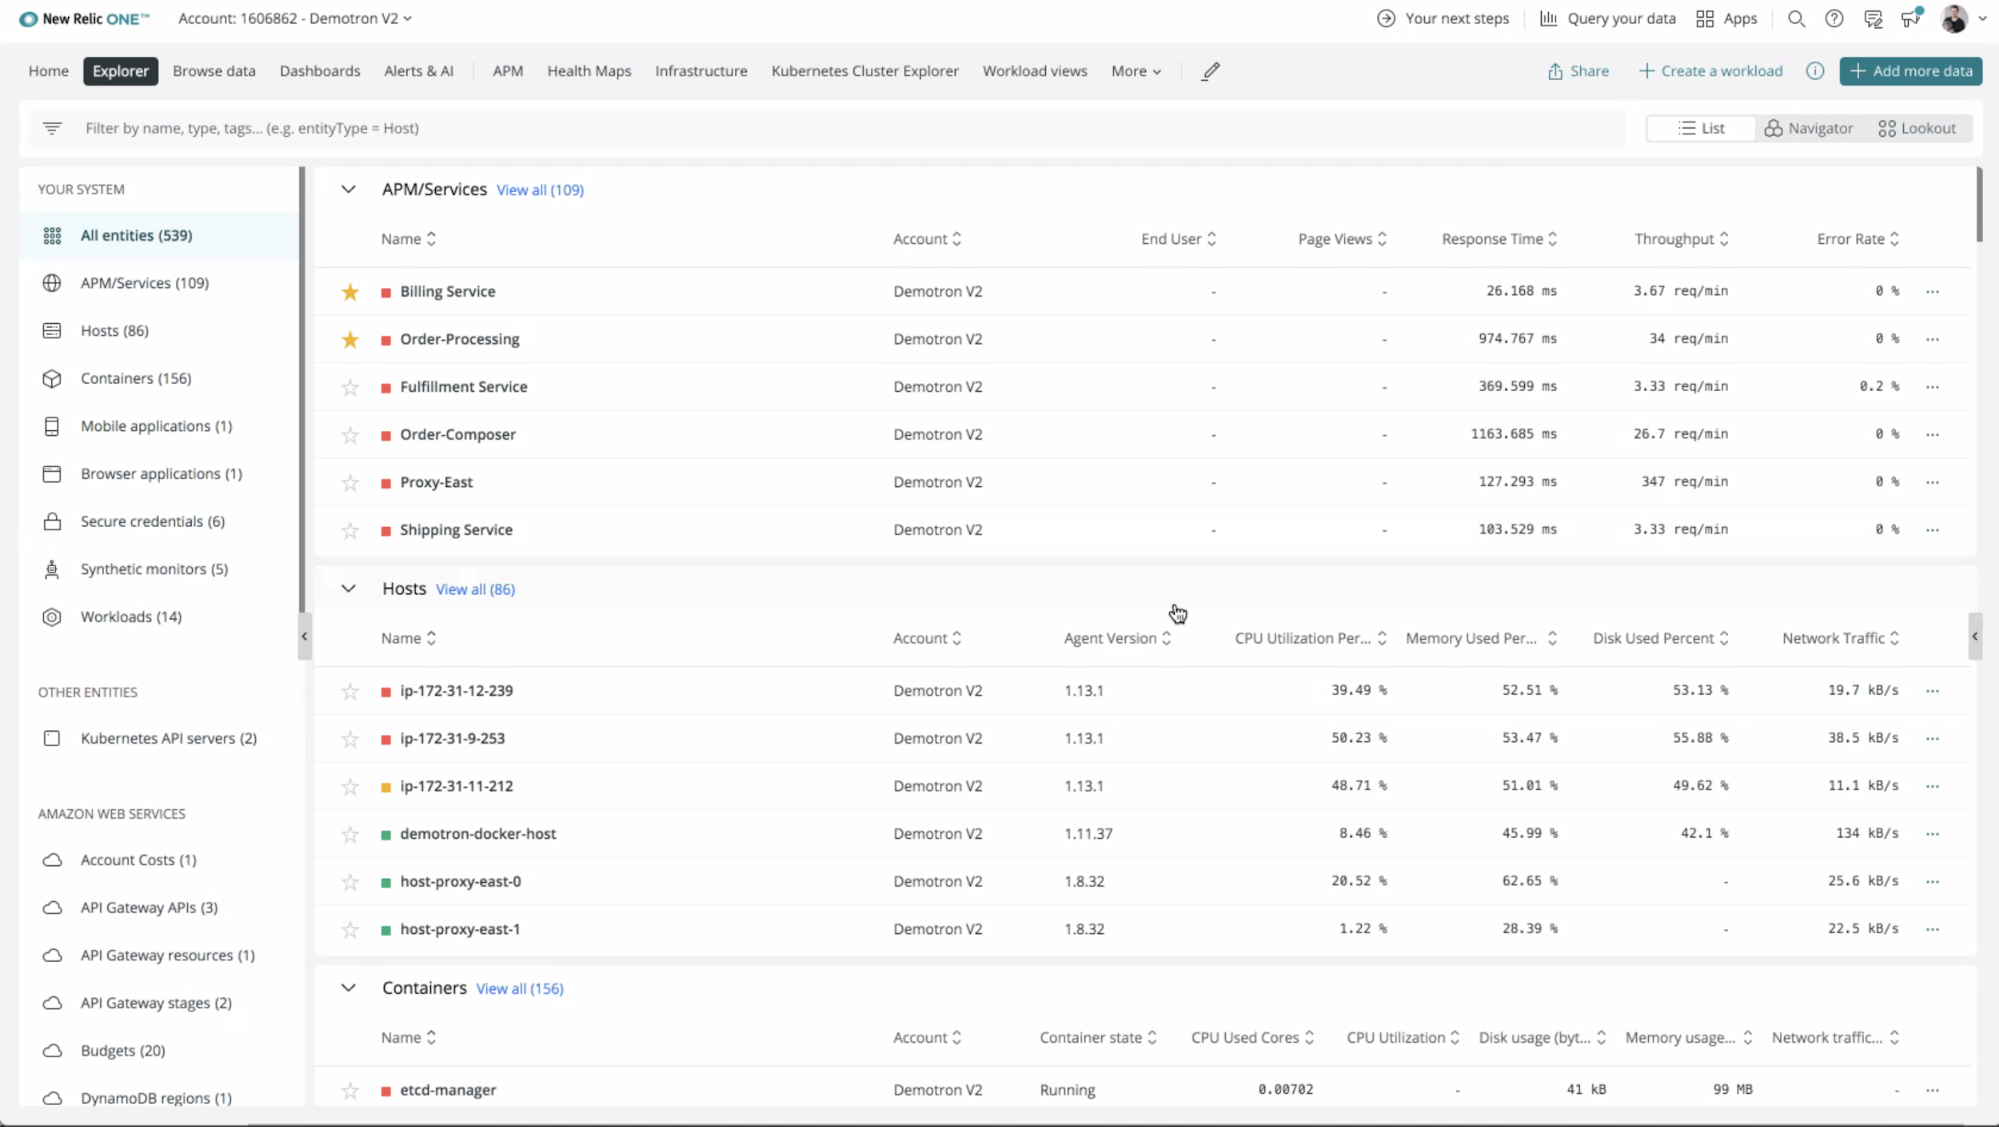
If you log into New Relic today, you’ll see a view that looks similar to what you’re used to, with a few noticeable improvements.
Much like the default view of applications or servers, you see the status and key stats in a list. But you’ll notice that it’s not one type of entity that appears here: you get containers, servers, hosts, and applications in a single, collective view.

The new Navigator view takes this collection of rows and gives you the “traffic light” status for all of your entities at once. When you’re awoken by a page in the middle of the night, it’s so nice to get this quick high level view of what’s going with your service as a whole, and it’s especially useful as teams embrace microservice architecture.
Subscribe to our Nerdlog emails to get weekly updates about the latest features and releases from the people who built them. Join the Nerdlog discussion live every Thursday at 12 p.m. PT (8 p.m. UTC) on Twitch, follow along in What’s New, or read about our Nerdlog episode 2 recap and New Relic Synthetics Step Builder.
If you're not a New Relic customer, sign up for your free account today.
이 블로그에 표현된 견해는 저자의 견해이며 반드시 New Relic의 견해를 반영하는 것은 아닙니다. 저자가 제공하는 모든 솔루션은 환경에 따라 다르며 New Relic에서 제공하는 상용 솔루션이나 지원의 일부가 아닙니다. 이 블로그 게시물과 관련된 질문 및 지원이 필요한 경우 Explorers Hub(discuss.newrelic.com)에서만 참여하십시오. 이 블로그에는 타사 사이트의 콘텐츠에 대한 링크가 포함될 수 있습니다. 이러한 링크를 제공함으로써 New Relic은 해당 사이트에서 사용할 수 있는 정보, 보기 또는 제품을 채택, 보증, 승인 또는 보증하지 않습니다.


