If you’re a Site Reliability Engineer (SRE), you’re familiar with the challenges of gathering operational data to identify issues. Sure, there are a plethora of point solutions you could use, but each solves only a specific challenge, and you’re often left with tool sprawl. What you really need is a simple way to send metrics to a single data store and the ability to visualize them anywhere.
Veneur, an open source tool built by Stripe, is a vendor-agnostic proxy-based metric collection pipeline that consolidates disparate observability data, including StatsD or DogStatsD metrics, trace spans, and synthetic checks. With Veneur you get:
- Reduced data ingestion and storage costs by pre-aggregating metrics (such as timers) into percentiles
- Improved efficiency over other metric aggregator implementations because vendors charge based on the number of metrics they consume
- Improved reliability by building a more resilient forwarding system over single points of failure
We’ve created a Veneur sink, which allows you to build a pipeline to send metrics to New Relic. For example, if you’re monitoring your servers with DogStatsD, you can easily switch pipelines and send that data to our Telemetry Data Platform—a single database where you can alert on and analyze that data to detect and resolve issues faster.
In the rest of this post, you’ll learn how to configure the Veneur sink to send data to the Telemetry Data Platform.
Install the New Relic Veneur sink
To complete these steps, you’ll need your New Relic account ID and an Insert API key. You’ll also need to install Docker. (This example shows how to do so on CentOs.)
Tip: You can also follow along in our working example.
- Start the Veneur Docker image. You’ll need to export the New Relic specific variables, and add your insert key and account ID:
export VENEUR_NEWRELICINSERTKEY='add your key here '

export VENEUR_NEWRELICACCOUNTID=add your account ID here

export VENEUR_NEWRELICREGION='us'
- Copy and paste the following to kick off the Veneur Docker container:
docker run --rm -it \

   --name veneur-docker \

   -p 8126:8126/udp \

   -p 8127:8127/tcp \

   --net=host \

   -e VENEUR_NEWRELICINSERTKEY \

   -e VENEUR_NEWRELICACCOUNTID \

   -e VENEUR_NEWRELICREGION \

   -e VENEUR_SIGNALFXAPIKEY='' \

   -e VENEUR_DATADOGAPIKEY='' \

   -e VENEUR_FALCONERADDRESS='' \

   -e VENEUR_XRAYADDRESS='' \

   -e VENEUR_DEBUG=true \

   stripe/veneur:13.2.0
View your metrics from Veneur in New Relic
Now that you’ve got the pipeline running, it’s time to send some metrics through Veneur sink and visualize them in New Relic.
- Go to one.newrelic.com, and in the upper right-hand corner, click Query your data and then click Query builder.
- In the query builder enter the following query:
SELECT count(`veneur.worker.span.flush_duration_ns.90percentile`) FROM Metric TIMESERIES SINCE 1800 seconds ago
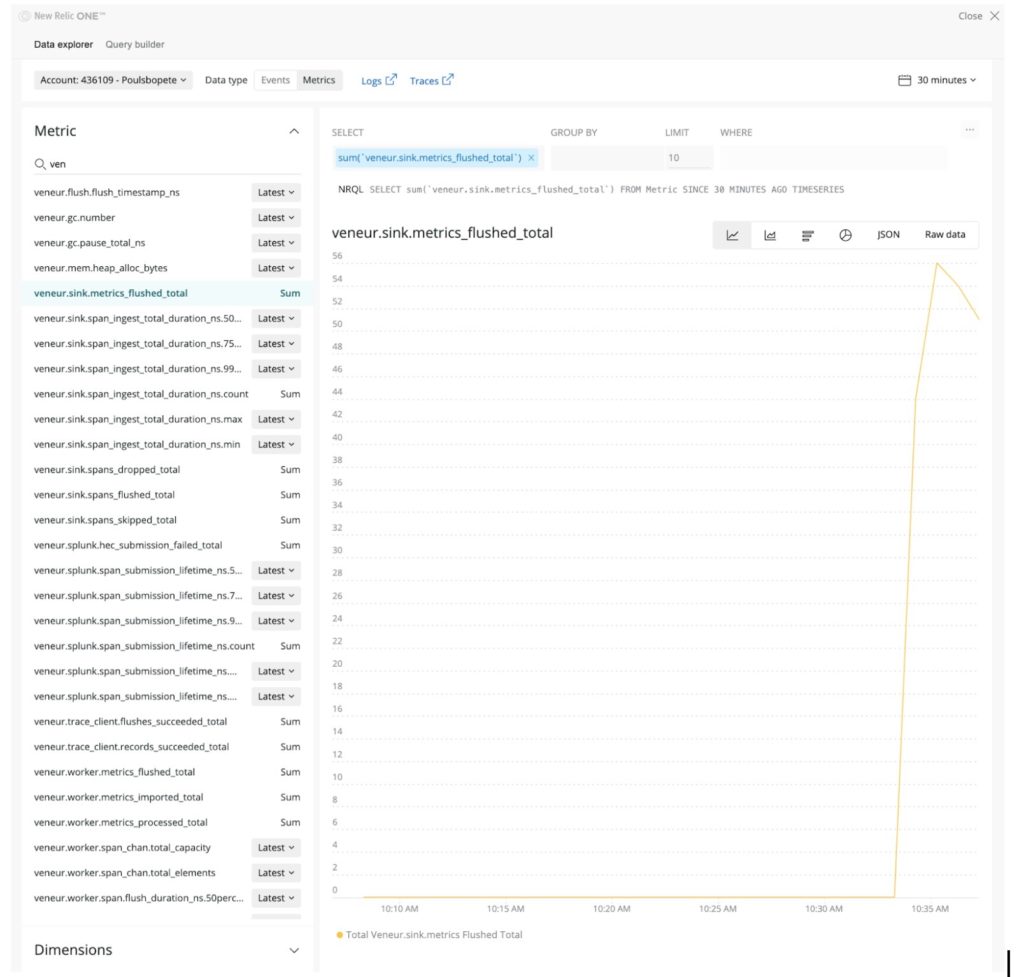
Once data is coming into New Relic, navigate to the data explorer (click Query your data > Data explorer), and search for Veneur metrics:
Congratulations, you now have data from Veneur flowing into the New Relic Telemetry Data Platform—these could even be DogStatsD metrics, events, and service checks.
Now that you have runtime data in New Relic, you might consider combining these metrics with business-relevant events, logs, and traces from tail-based infinite tracing.
Try out Veneur and other integrations today
With the Telemetry Data Platform, you can send data to New Relic from any number of data sources, including Prometheus, Telegraf, Micrometer, NestJS, Veneur, and plenty of others. To track your infrastructure monitoring and more, check how we've helped ZenHub with exactly this.
If you’re not already a New Relic user, there’s no better time to get started. You can send 100 GB per month to the Telemetry Data Platform and enjoy complete access to all of New Relic—free forever. Sign up and create your free account today.
이 블로그에 표현된 견해는 저자의 견해이며 반드시 New Relic의 견해를 반영하는 것은 아닙니다. 저자가 제공하는 모든 솔루션은 환경에 따라 다르며 New Relic에서 제공하는 상용 솔루션이나 지원의 일부가 아닙니다. 이 블로그 게시물과 관련된 질문 및 지원이 필요한 경우 Explorers Hub(discuss.newrelic.com)에서만 참여하십시오. 이 블로그에는 타사 사이트의 콘텐츠에 대한 링크가 포함될 수 있습니다. 이러한 링크를 제공함으로써 New Relic은 해당 사이트에서 사용할 수 있는 정보, 보기 또는 제품을 채택, 보증, 승인 또는 보증하지 않습니다.


