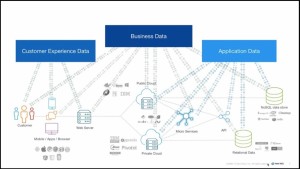
Doing business online today is a lot more complicated than it used to be. Application platforms are incredibly complex, often incorporating both public and private clouds as well as various microservices and backend databases and repositories. And things are more complex at the frontend, too.

“Long gone are the days when you were just sending static HTML out to your customers,” says Steve Ippoliti, technical account manager at New Relic, in this latest webinar. “Today, you’re expected to deliver highly responsive single page and mobile applications, which need to perform consistently across all platforms to ensure the customer’s overall satisfaction.”
That satisfaction is key to the success of your business. Achieving it is a matter of managing your applications as effectively as possible. And that requires gathering, analyzing, and acting upon the enormous quantities of data at your disposal.
That’s where New Relic comes in. Offering real-time visibility into the metrics that really matter, monitoring with New Relic is designed to help you improve application performance, customer experience, and, ultimately, business outcomes. According to Steve, mastering those three buckets—application data, customer experience data, and business data—yields a true application understanding. “That’s what we’re all striving for,” he says.
To see Steve demonstrate the benefits of two of New Relic’s most popular products, New Relic APM and New Relic Browser, watch the webinar here, or read on for some highlights:
Drill down into each transaction
At the core of New Relic APM is the Transactions tool. This monitors all of your backend transactions in the application server to provide essential response-time metrics. The Transaction Trace function enables you to drill down into the granular specifics of each transaction—including calls to third-party applications—and identify which particular elements may be contributing to an overall slowdown. This detailed visibility facilitates proactive, efficient, and targeted troubleshooting that helps you keep your application running as smoothly as possible.
Keep the frontend front and center
Fast backend transactions, however, don’t guarantee a satisfactory user experience. Frontend issues can be just as problematic and can easily go unnoticed. New Relic Browser can help keep that from happening. By monitoring and reporting how a given Web browser is perceiving and processing the information it receives—covering page rendering time, DOM processing, backend Web app, and network time—you can use New Relic Browser to get a clear picture of the interaction between frontend and backend functions. The Page View tool, for example, breaks down which backend transactions were involved in a given page view, and how they impacted response time for that particular user.
New Relic Browser even lets you monitor Ajax calls, keeping track of response time, callback time, overall throughput, and average data transfers per request. “If your Ajax calls are sending a boatload of data that is causing your users to have slow performance, you’ll see that here,” says Steve.
Want to learn more?
Be sure to visit our Resource Library, where you’ll find many more recorded webinars about New Relic’s different products.
이 블로그에 표현된 견해는 저자의 견해이며 반드시 New Relic의 견해를 반영하는 것은 아닙니다. 저자가 제공하는 모든 솔루션은 환경에 따라 다르며 New Relic에서 제공하는 상용 솔루션이나 지원의 일부가 아닙니다. 이 블로그 게시물과 관련된 질문 및 지원이 필요한 경우 Explorers Hub(discuss.newrelic.com)에서만 참여하십시오. 이 블로그에는 타사 사이트의 콘텐츠에 대한 링크가 포함될 수 있습니다. 이러한 링크를 제공함으로써 New Relic은 해당 사이트에서 사용할 수 있는 정보, 보기 또는 제품을 채택, 보증, 승인 또는 보증하지 않습니다.


