New Relic partnered with Enterprise Technology Research (ETR) to conduct a survey and analysis for this fourth annual Observability Forecast report.
What’s new
We added another country this year (Brazil) and updated the regional distribution. We repeated many of last year’s questions to compare trends year-over-year and added seven new ones to gain additional insights.
For industries, we broke out media/entertainment this year, separated IT from telco, and removed unspecified.
We added two additional observability capabilities—artificial intelligence (AI) monitoring and business observability—bringing the total number of observability capabilities covered in this year’s report to 19. We also provided survey takers with brief definitions for each observability capability to improve clarity, which was deemed especially necessary for emerging or contested areas. Providing these definitions inherently constrained survey-takers’ interpretations of each of these capabilities. As such, we can be more certain in our claims and data quality overall, but such constraints led to deployment percentages dropping this year compared to previous years.
This year, we included sections in the survey for the average revenue cost per hour of downtime for each outage business impact level (low, medium, and high). This addition enabled us to tabulate the median annual outage cost across all business-impact levels, in addition to the median annual downtime.
We also updated the answer format for all currency-, time-, and quantity-related questions to sliders instead of ranges. The sliders enabled survey takers to select a more precise amount, which enabled us to tabulate the median amount across all respondents for these questions. For example, we’ve tabulated the median annual observability spend, median annual downtime, median annual outage cost, median total annual value from their observability investment, median engineering time spent addressing disruptions, and median return on investment (ROI).
In addition to mean time to resolution (MTTR), we also asked survey takers about how their organization’s mean time to detection (MTTD) for outages changed since adopting an observability solution.
And, finally, survey takers were able to select all that apply instead of only three options for the benefits and challenges questions. Widening the options that survey takers can select makes year-over-year comparisons more challenging.
Definitions
We’ve defined some common terms and concepts used throughout this report.
Observability
To avoid bias, we did not define observability for survey takers.
Observability enables organizations to measure how a system performs and identify issues and errors based on its external outputs. These external outputs are called telemetry data and include metrics, events, logs, and traces (MELT). Observability is the practice of instrumenting systems to surface insights for various roles so they can take immediate action that impacts customer experience and service. It also involves collecting, analyzing, altering, and correlating that data for improved uptime and performance.
Achieving observability brings a connected, real-time view of all data from different sources—ideally in one place—where teams can collaborate to troubleshoot and resolve issues faster, prevent issues from occurring, ensure operational efficiency, and produce high-quality software that promotes an optimal customer/user experience and competitive advantage.
Software engineering, development, site reliability engineering, operations, and other teams—plus managers and executives—use observability to understand the behavior of complex digital systems and turn data into tailored insights. Observability helps them pinpoint issues more quickly, understand root causes for faster, simpler incident response, and proactively align data with business outcomes.
A subset of observability, organizations use monitoring to identify problems in the environment based on prior experience that’s expressed as a set of conditions (known unknowns). Monitoring enables organizations to react to these conditions and is sufficient to solve problems when the number and complexity of possible problems are limited.
Organizations use observability to determine why something unexpected happened (in addition to the what, when, and how), particularly in complex environments where the possible scope of problems and interactions between systems and services is significant. The key difference is that observability does not rely on prior experience to define the conditions used to solve all problems (unknown unknowns). Organizations also use observability proactively to optimize and improve environments.
Monitoring tools alone can lead to data silos and data sampling. In contrast, an observability platform can instrument an entire technology stack and correlate the telemetry data drawn from it in a single location for one unified, actionable view.
Many tools are purpose-built for observability and include capabilities such as:
Analysis and incident management
- AIOps (artificial intelligence for IT operations) capabilities
- Alerts
- Error tracking
Apps and services
- Application performance monitoring (APM)
- Distributed tracing
- Serverless monitoring
Artificial intelligence (AI)
- AI monitoring
- Machine learning (ML) model monitoring
Business impact and visibility
- Business observability
- Dashboards
Digital experience monitoring (DEM)
- Browser monitoring
- Mobile monitoring
- Synthetic monitoring
Infrastructure
- Database monitoring
- Infrastructure monitoring
- Kubernetes (K8s) monitoring
- Network performance monitoring
Log management
Security monitoring
Monitoring | Observability |
|---|---|
Monitoring Reactive | Observability Proactive |
Monitoring Situational | Observability Predictive |
Monitoring Speculative | Observability Data-driven |
Monitoring What + when | Observability What + when + why + how |
Monitoring Expected problems (known unknowns) | Observability Unexpected problems (unknown unknowns) |
Monitoring Data silos | Observability Data in one place |
Monitoring Data sampling | Observability Instrument everything |
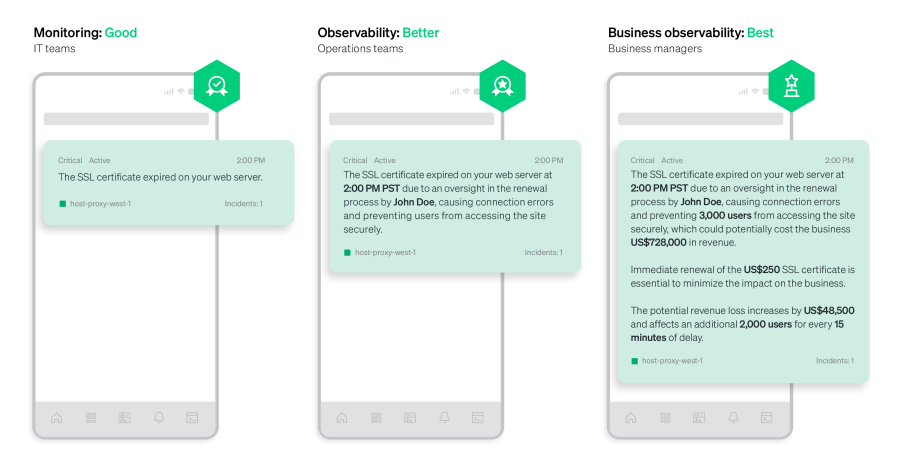
Business observability takes that a step further by offering comprehensive visibility and quantifying business impact.

Full-stack observability
The ability to see everything in the tech stack that could affect the customer experience is called full-stack observability or end-to-end observability. It’s based on a complete view of all telemetry data.
Adopting a data-driven approach for end-to-end observability helps empower engineers and developers with a complete view of all telemetry data so they don’t have to sample data, compromise their visibility into the tech stack, or waste time stitching together siloed data. Instead, they can focus on the higher-priority, business-impacting, and creative coding they love. And it provides executives and managers with a comprehensive view of the business and enables them to understand the business impact of interruptions.
Full-stack observability, as used in this report, is achieved by organizations that deploy specific combinations of observability capabilities, including apps and services, log management, infrastructure (backend), DEM (frontend), and security monitoring.
See how many respondents had achieved full-stack observability and the advantages of achieving full-stack observability.
monitoring
services
experience
monitoring
management
observability
Roles, job titles, descriptions, and common key performance indicators (KPIs) for practitioners and ITDMs
| Roles | Job titles | Descriptions |
|---|---|---|
| RolesDevelopers | Job titlesApplication developers, software engineers, architects, and their frontline managers | DescriptionsMembers of a technical team who design, build, and deploy code, optimizing and automating processes where possible |
| RolesOperations professionals | Job titlesIT operations engineers, network operations engineers, DevOps engineers, DevSecOps engineers, SecOps engineers, site reliability engineers (SREs), infrastructure operations engineers, cloud operations engineers, platform engineers, system administrators, architects, and their frontline managers | Descriptions Members of a technical team who are responsible for the overall health and stability of infrastructure and applications Detect and resolve incidents using monitoring tools, build and improve code pipeline, and lead optimization and scaling efforts |
| RolesNon-executive managers | Job titlesDirectors, senior directors, vice presidents (VPs), and senior vice presidents (SVPs) of engineering, operations, DevOps, DevSecOps, SecOps, site reliability, and analytics | Descriptions Leaders of practitioner teams that build, launch, and maintain customer-facing and internal products and platforms Own the projects that operationalize high-level business initiatives and translate technology strategy into tactical execution Constantly looking to increase velocity and scale service |
| RolesExecutives (C-suite) | Job titles More technical focused: Chief information officers (CIOs), chief information security officers (CISOs), chief technology officers (CTOs), chief data officers (CDOs), chief analytics officers (CAOs), and chief architects Less technical focused: Chief executive officers (CEOs), chief operating officers (COOs), chief financial officers (CFOs), chief marketing officers (CMOs), chief revenue officers (CROs), and chief product officers (CPOs) | Descriptions Managers of overall technology infrastructure and cost who are responsible for business impact, technology strategy, organizational culture, company reputation, and cost management Define the organization’s technology vision and roadmap to deliver on business objectives Use digital technology to improve customer experience and profitability, enhancing company reputation as a result |
Methodology
All data in this report are derived from a survey, which was in the field from April to May 2024.
ETR qualified survey respondents based on relevant expertise. ETR performed a non-probability sampling type called quota sampling to target sample sizes of respondents based on their country of residence and role type in their organizations (in other words, practitioners and ITDMs). Geographic representation quotas targeted 16 key countries.
To avoid skewing results by industry, subsamples of n<10 are excluded from some analysis in this report.
All quotes were derived from interviews conducted by ETR with IT professionals who use observability.
All dollar amounts in this report are in USD.
About ETR
ETR is a technology market research firm that leverages proprietary data from its targeted ITDM community to deliver actionable insights about spending intentions and industry trends. Since 2010, ETR has worked diligently at achieving one goal: eliminating the need for opinions in enterprise research, which are typically formed from incomplete, biased, and statistically insignificant data.
The ETR community of ITDMs is uniquely positioned to provide best-in-class customer/evaluator perspectives. Its proprietary data and insights from this community empower institutional investors, technology companies, and ITDMs to navigate the complex enterprise technology landscape amid an expanding marketplace.
About New Relic
The New Relic Intelligent Observability Platform helps businesses eliminate interruptions in digital experiences. New Relic is the only platform to unify and pair telemetry data to provide clarity over the entire digital estate. We move problem solving past proactive to predictive by processing the right data at the right time to maximize value and control costs. That’s why businesses around the world—including Adidas Runtastic, American Red Cross, Domino’s, GoTo Group, Ryanair, Topgolf, and William Hill—run on New Relic to drive innovation, improve reliability, and deliver exceptional customer experiences to fuel growth. Visit www.newrelic.com.
Citing the report
Suggested citation for this report:
- APA Style:
Basteri, A. (2024, October). 2024 Observability Forecast. New Relic, Inc. https://newrelic.com/resources/report/observability-forecast/2024 - The Chicago Manual of Style:
Basteri, Alicia. October 2024. 2024 Observability Forecast. N.p.: New Relic, Inc. https://newrelic.com/resources/report/observability-forecast/2024.
Demographics
In 2024, ETR polled 1,700 technology professionals—more than any other observability study—in 16 countries across the Americas, Asia Pacific, and Europe. Approximately 35% of respondents were from Brazil (new this year), Canada, and the United States. France, Germany, Ireland, and the United Kingdom represented 21% of respondents. The remaining 44% were from the broader Asia-Pacific region, including Australia, India, Indonesia, Japan, Malaysia, New Zealand, Singapore, South Korea, and Thailand.
The survey respondent mix was about the same as in 2021, 2022, and 2023—65% practitioners and 35% ITDMs.
Regions
Respondent demographics, including regions, countries, and roles
Firmographics
More than half of survey respondents (57%) worked for large organizations, followed by 34% for midsize organizations, and 9% for small organizations.
Less than a quarter (17%) cited $500,000 to $9.99 million, 26% cited $10 million to $99.99 million, and 57% cited $100 million or more in annual revenue.
The respondent pool represented a wide range of industries, including IT, financial services/insurance, industrials/materials/manufacturing, retail/consumer, healthcare/pharmaceutical (pharma), energy/utilities, services/consulting, telecommunications (telco), education, government, media/entertainment (new this year), and nonprofit.
Respondent firmographics, including organization size, annual revenue, and industries

