Why monitoring kafka is so important
Apache Kafka is a fault-tolerant, scalable messaging system used to build real-time data pipelines. Kafka also supports replications natively, and you can build streaming applications that run inside production environments.
Leveraging a Kafka monitoring tool to monitor data replication, retention, and issues like consumer lag is important. New Relic’s Kafka quickstart lets you look at performance metrics and inventory data, create your own custom charts and queries, and create alert policies.


New Relic + Kafka quickstart
New Relic’s performance monitoring provides instant observability out-of-the-box. This quickstart includes:
- Monitoring Kafka topics
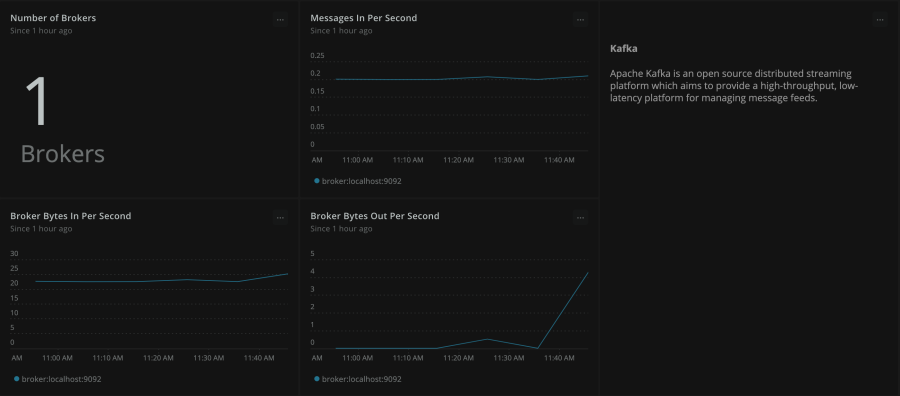
- Dashboards tracking brokers, messages per sec, broker bytes in and out per sec, consumer lag, and more
- Monitoring of producers and consumers coded in Java
New Relic - Complete Kafka Monitoring
One of the key features of New Relic’s Kafka monitoring is that you can configure your retention settings by time and by space and set up real-time alerts. Track key metrics like gauge, count, and summary as well with New Relic’s instant observability quickstart. Ensure that your infrastructure remains robust and running while averting potential data loss by monitoring Kafka brokers and Kafka producers.


