Quickstart
Why monitor Netty?
Netty is a tool for building performant, low-level network servers and clients in Java. It operates on an asynchronous, non-blocking I/O model, meaning that it can serve or receive multiple requests simultaneously while maintaining running background processes.
While Netty is powerful and runs with lower resource usage than its blocking counterparts, its non-blocking paradigm makes the code it creates harder to test and more difficult to read. The fact that it operates at a low level close to the hardware makes it prone to difficult-to-debug errors. Thus, actively monitoring each Netty instance is vital to keeping all the servers and clients on which it is based running smoothly. The Netty quickstart provides dashboards and alerts that enable continuous monitoring of Netty application health.
New Relic Netty quickstart features
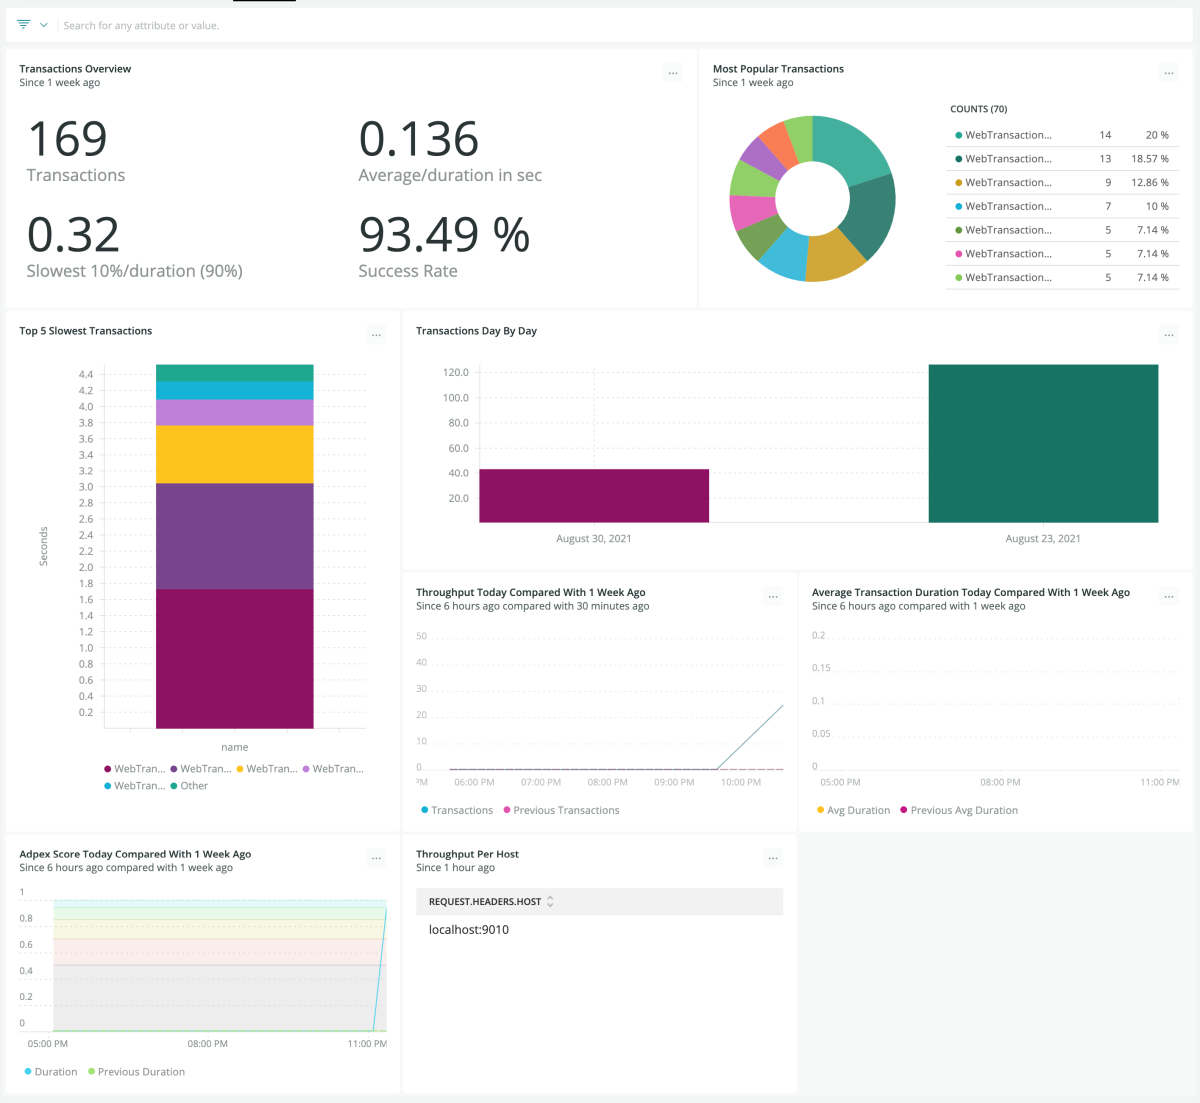
The Netty quickstart contains a number of helpful dashboards and alerts that monitor your Netty performance. These include
Dashboards
- Transactions overview provides information about average transaction duration, slowest 10% duration transactions, total transactions, and success rates.
- The errors overview gives insight into total transactions and failed transactions by both percentages and total numbers.
- The VM overview lets you introspect average CPU utilization, average physical memory usage, and total average memory used.
- The top 10 failed transactions dashboard shows failed transactions with the greatest impact.
- The latest error dashboard gives insights into recent errors.
- And more.
Alerts
- The CPU utilization alert is triggered at 90% usage.
- The high memory usage alert is triggered at 90% usage
- The low APDEX score alert is triggered when it falls below 0.5 for 5 mins.
- The transaction error alert is triggered by >10% transaction failure rate over 10 mins.
New Relic - The Complete Netty Dashboard Tool
Monitor your Netty application to ensure its success and stability. Servers often experience high loads, where hundreds of thousands, even millions, of requests can hit them simultaneously. The New Relic Netty dashboard empowers developers and system admins to stay on top of Netty’s performance and address any critical issues that arise. Having insight into Netty, the state of Netty transactions, and associations such as the Apdex score, are important for ensuring a client is acceptably handling the majority of inbound and outbound requests. If requests begin failing, and the Apdex score dips significantly, this could be an indicator that something is going wrong in the system - perhaps there’s a concurrency issue, a need to scale up the server’s resources, a backend bug, or something else. The New Relic Netty quickstart allows these errors to be flagged with alerts and then drilled down into using the metrics provided in the dashboards. Specifically, the quickstart automatically sets up dashboards with meaningful metrics and default alert notifications for common Netty issues.
The Netty dashboards provide users tools to monitor global Java VM health, so that if there’s another Java application dragging the system down, it can be identified and addressed before a Netty server, client, or network protocol crashes.
Need help? Visit our Support Center or check out our community forum, the Explorers Hub.

