The rise of serverless architecture has empowered developers to take advantage of increased agility, scalability, and efficiency for customer-facing applications and critical workloads.
However, as infrastructure is abstracted away from the enterprise, new complexities emerge that make it difficult to debug and monitor applications. New Relic Serverless enables developers to monitor, visualize, troubleshoot, and alert on all of their functions in a single experience so they can function faster.
And today, New Relic announced it has achieved the AWS Lambda Ready designation, part of the Amazon Web Services (AWS) Service Ready Program. This distinction recognizes that New Relic Serverless has demonstrated successful integration with AWS Lambda.
Achieving the AWS Lambda Ready designation differentiates New Relic as an AWS Partner Network (APN) member with a product that integrates with AWS Lambda and is generally available and fully supported for AWS customers. AWS Service Ready Partners also have demonstrated success in building products integrated with AWS services, which helps AWS customers evaluate and use their technology productively, at scale, and with varying levels of complexity.
“With the rise of serverless offerings like AWS Lambda, it has never been easier for developers to build software and deploy it to production,” said Andrew Tunall, GM, New Relic Serverless and Emerging Cloud Solutions. “We’re proud to achieve AWS Lambda Ready status, and we’re dedicated to providing full serverless observability for our customers leveraging the performance and accelerated time to market that AWS provides. Learn how to boost observability with Snowflake
Understanding and “right-sizing” your AWS Lambda functions with new serverless monitoring features
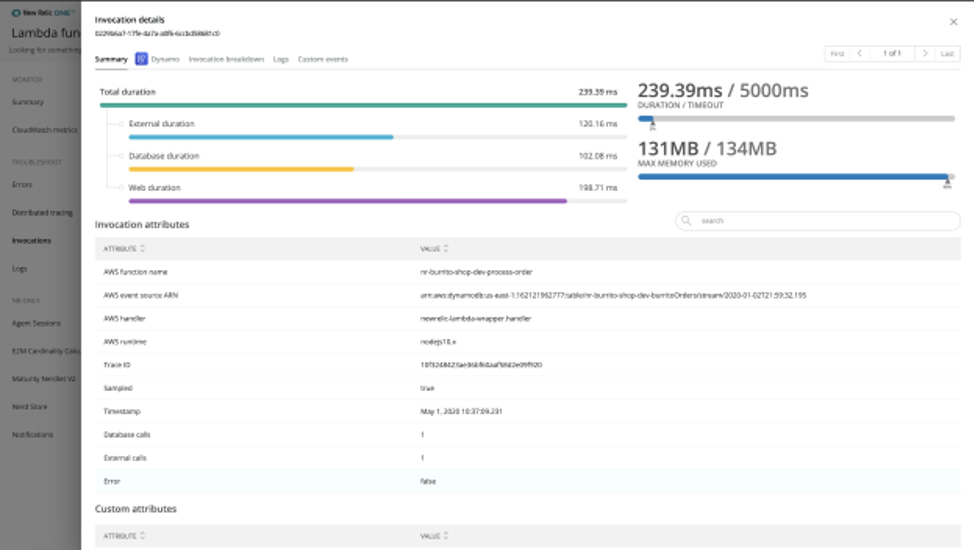
As part of New Relic’s ongoing mission to improve the experience of building serverless applications, we’ve enhanced our invocation and error views so you can quickly drill down to the data you need—in the right context.
With access to error details—including duration breakdowns, event sources, and logs in context—developers can not only identify invocation errors in the UI, but also immediately explore how long each invocation ran, which AWS service triggered it, and get all of the specific metadata attributes related to the error.

In addition, our latest release includes max memory usage versus your configured memory tier to help you “right size” your Lambda functions and potentially lower your cloud costs. With AWS Lambda, you pay only for what you use. You are charged based on the number of requests for your functions and the duration—the time it takes for your code to execute. Since the price for duration depends on the amount of memory you allocate to your function, understanding how much memory you’re actually using helps prevent overpaying for memory your functions aren’t using.
Lastly, users can now filter and facet metrics and invocations by specific versions or aliases. This feature enables developers to instantly drill down into the behavior of their different Lambda function versions and aliases throughout development, beta, and production environments—without writing queries. With different versions deployed to each environment, it’s critical for developers to be able to quickly slice and dice invocation data by version across each stage of deployment, especially if there’s an anomaly in production that wasn’t identified in testing.
Visit New Relic Serverless for AWS Lambda to learn more about our latest features or to get started monitoring your AWS Lambda functions today.
Las opiniones expresadas en este blog son las del autor y no reflejan necesariamente las opiniones de New Relic. Todas las soluciones ofrecidas por el autor son específicas del entorno y no forman parte de las soluciones comerciales o el soporte ofrecido por New Relic. Únase a nosotros exclusivamente en Explorers Hub ( discus.newrelic.com ) para preguntas y asistencia relacionada con esta publicación de blog. Este blog puede contener enlaces a contenido de sitios de terceros. Al proporcionar dichos enlaces, New Relic no adopta, garantiza, aprueba ni respalda la información, las vistas o los productos disponibles en dichos sitios.


