With SAP applications powering an increasing number of critical business processes, we recognize that ITOps teams need to be able to quickly understand system health at-a-glance and immediately troubleshoot performance issues for SAP solutions within the context of their overall ecosystem.
With New Relic Monitoring for SAP® solutions, you can now inspect all of your SAP and non-SAP systems through one centralized view of your infrastructure, application, and business processes. It’s also SAP-certified, so it works well with their technology.
Now you’ll be able to:
- See SAP application performance and overall health data in one place. Your telemetry metrics, events, logs, and traces all come together in a central view within our UI.
- View your data in relation to your business processes. Understand your infrastructure and application data from the viewpoint of your corresponding business processes, such as order-to-cash and procure-to-pay.
- Spot problems quickly with visualizations. By querying and viewing relevant data in our customizable charts and dashboards, you can identify root causes and resolve problems.
- Prevent problems before they occur. Use our advanced alerting functionality to be notified about problems before they impact your customers.
- Install monitoring centrally for end-to-end visibility. This tool can be installed on a central monitoring server, so you won’t need to install agents on all of your SAP production servers.
Connect with your account team to configure New Relic monitoring for SAP. If you’re not a current customer, schedule a demo or sign up today for your free account.
The need for SAP observability
As businesses increasingly rely on a complex collection of software services to power their foundational business functions, performance issues can make a severe impact. Any latency in production orders, invoices, and status reports hinder an organization's ability to innovate. These issues can be challenging to track down and involve issues within SAP systems and non-SAP systems.
With New Relic monitoring for SAP solutions, you get a centralized view of all of your infrastructure, application, and business processes, whether they are SAP or not. This can help your IT teams to gain early awareness and quickly resolve interruptions and system issues.
Here are some common cases where New Relic monitoring for SAP solutions can help you identify and resolve issues:
- A large customer stops receiving order confirmations because IDocs were sent to a failed partner port.
- Accounts payable vendor invoices aren't paid when you need them to be, due to a sudden surge of program errors in failed background jobs, caused by a recent new deployment.
- Production orders aren’t going out in a timely manner because of inefficient database calls in a program.
- Your users in a particular region are experiencing intermittent slowness due to an imbalance of traffic between application servers.
Best-in-class observability for SAP from New Relic
With New Relic, you can gain visibility into the performance and overall health of your entire SAP systems or individual components with an SAP-friendly integration. Monitor the underlying entities that keep your SAP processes flowing while also gaining visibility into your systems running on cloud platforms like AWS or Microsoft Azure.
Prebuilt visualizations
New Relic provides curated and extensible visualization tools such as dashboards, entities, workloads, and traces, including anomaly detection and alerts. You’ll be able to monitor both SAP and non-SAP systems from a single view. In addition, business and IT team members can access the same views on SAP performance to drive efficient communication and collaboration.
Centralized end-to-end observability
Access all telemetry data such as logs, metrics, events, and traces from your multiple SAP systems in one place, with the ability to easily query historical performance and current trends.
Workloads in context of business processes
New Relic brings business context to your monitoring, based on your business process workload, as shown in the next screenshot.
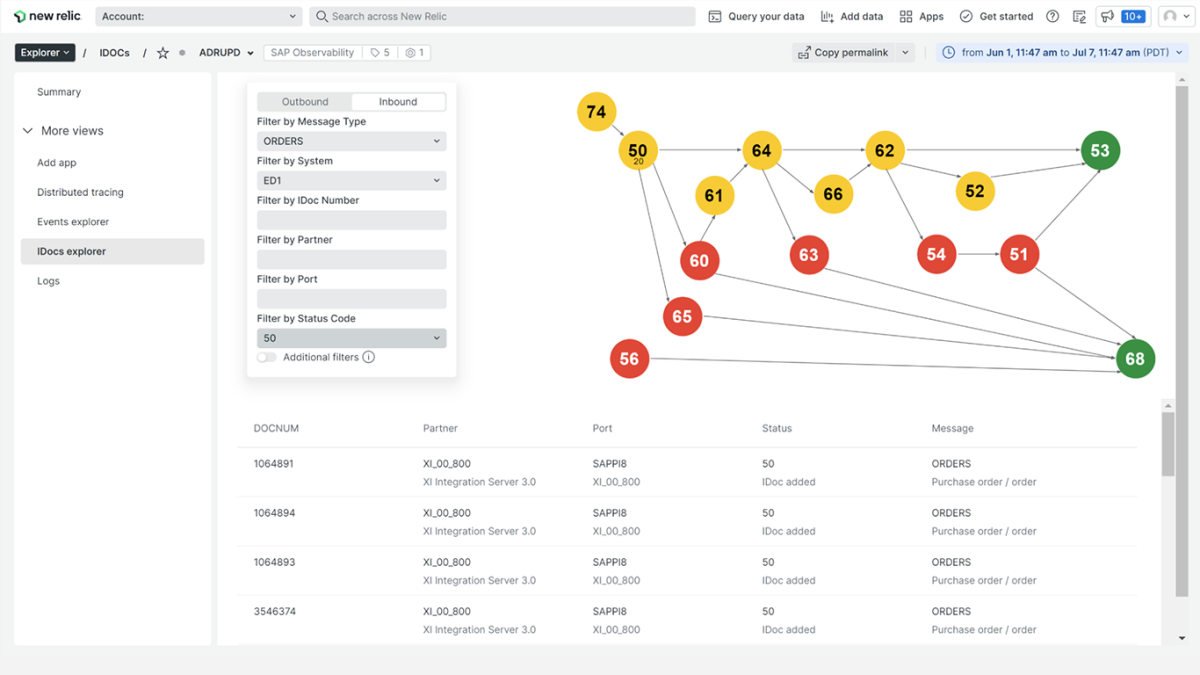
SAP IDoc explorer
With our SAP IDocs explorer, you’ll get a visual representation of IDoc errors. They’re accompanied by relevant information and context to help you resolve those errors, allowing business processes to keep flowing.
Fast root cause identification with SAP traces
Get automatic insights into the possible root cause of issues, including relevant deployment info, error logs, and attributes.
Dynamic baseline alerts
Using dynamic thresholds, your alerts will automatically adjust to unforeseen flow changes or other shifts in your business.
Próximos pasos
Want to try this solution? Contact your account team to get set up with New Relic monitoring for SAP. If you’re not a current customer, schedule a demo or sign up today for a free account.
Want to learn more about how you can set up this all-in-one view? See our documentation: Integrate SAP observability with New Relic.
Join our New Relic Slack community to continue the conversation with hundreds of other developers using New Relic.
Las opiniones expresadas en este blog son las del autor y no reflejan necesariamente las opiniones de New Relic. Todas las soluciones ofrecidas por el autor son específicas del entorno y no forman parte de las soluciones comerciales o el soporte ofrecido por New Relic. Únase a nosotros exclusivamente en Explorers Hub ( discus.newrelic.com ) para preguntas y asistencia relacionada con esta publicación de blog. Este blog puede contener enlaces a contenido de sitios de terceros. Al proporcionar dichos enlaces, New Relic no adopta, garantiza, aprueba ni respalda la información, las vistas o los productos disponibles en dichos sitios.


