Things break. Even the most well-tested applications throw unexpected errors, especially once they’re out in the real world, serving real users. The challenge isn’t just knowing that something broke, it’s understanding why, and fixing it before it affects too many people.
But that’s easier said than done. Between microservices, third-party dependencies, and constant code changes, finding the root cause can feel like untangling a moving thread. And while your team is trying to piece things together, users are dropping off, support tickets are piling up, and revenue might be walking out the door.
That’s where error analytics comes in — not just as a way to surface what’s wrong, but as a system for spotting patterns, narrowing causes, and solving issues fast. In this post, we’ll walk through how a structured approach to error analysis helps teams cut downtime and protect user experience. We’ll also show you how observability can help you reduce the guesswork and how tools like New Relic make the whole process more efficient, reliable, and scalable.
Why error analytics matters
Modern applications are complex — built on microservices, APIs, third-party integrations, and cloud infrastructure. When something breaks, the impact isn’t always obvious right away. What starts as a few 500 errors in one service can quickly snowball into failed transactions, frustrated users, and revenue loss. And that revenue loss adds up fast. A report from Forbes estimated the cost of unplanned downtime at around $9,000 per minute for large enterprises. According to Atlassian, even mid-sized businesses can see costs ranging from $5,600 to $9,000 per minute, depending on their industry and dependency on digital services. But it’s not just about the money. Repeated or prolonged errors damage user trust, increase pressure on support teams, and slow down development as engineers are pulled away from roadmap work to chase incidents. Furthermore, it can taint the brand itself.
This is where error analytics, and more broadly, observability becomes critical. According to New Relic Observability Forecast Report 2024, teams that invest in full-stack observability resolve outages 18% faster. Companies also report up to 79% less downtime and 48% lower outage costs when observability is built into their workflows from the start.
While observability gives you the big picture, error analytics helps you zoom in. It tells you what’s failing, where, and how often, turning scattered error signals into actionable insights. Instead of guessing or relying on anecdotal reports, you can trace patterns, identify root causes, and resolve issues with confidence.
Done right, error analytics shifts the conversation from reactive debugging to proactive prevention. Which means fewer support tickets, fewer late-night pages, and a more stable experience for users all of which contribute directly to business performance.
Challenges in identifying root causes
Most engineering teams know something’s wrong long before they know why. When errors hit production, it’s not unusual for the investigation to take longer than the fix itself. Here are some of the biggest blockers:
- Errors surface far from their source:
A frontend might show a 500 error, but the real issue could be buried in a backend service or even a downstream dependency. The service reporting the error isn’t always the one at fault. Without full visibility into the system, engineers can end up chasing the wrong thing, burning time on symptoms instead of solving the root problem. - Too many disconnected tools:
It’s common for teams to flip between dashboards for metrics, logs, traces, alerts, deployment histories, and incident reports, all living in different systems. Each tool has part of the answer, but no single place tells the full story. This tool sprawl leads to siloed insights, missed patterns, and long triage cycles. - Missing context in logs and traces:
Even when you find the right log line or trace, it may not be clear what triggered it. Key context such as user identity, recent deployments, request paths, or feature flags is often missing from these logs. And without that, the error might look isolated when it's actually part of a larger issue. - Manual debugging doesn't scale:
For smaller teams or monolithic systems, intuition-based debugging might work. But when you’re running dozens of microservices with complex interdependencies, gut feel and tribal knowledge fall apart. The margin for error is smaller, and the blast radius is bigger. - Time is already ticking:
Time spent investigating errors isn't just an engineering cost, it's a business one. Every minute of downtime means lost transactions, frustrated users, and strained SLAs. And even once it’s resolved, the lack of a clear root cause means the issue could return.
These challenges make one thing clear: without a focused approach to error analysis, one that brings context, correlation, and visibility together, you're always a few steps behind the problem.
Simplifying error troubleshooting using New Relic
Solving for root cause isn’t just about having data, it’s about reducing the time and effort it takes to move from detection to understanding. The faster a team can connect an error to its origin, the sooner they can restore reliability and avoid repeat issues.
New Relic supports this by aligning key signals such as errors, traces, and logs, into a connected workflow built for fast investigation and high confidence in diagnosis. Several tools across the platform contribute to this workflow, including:
Errors inbox
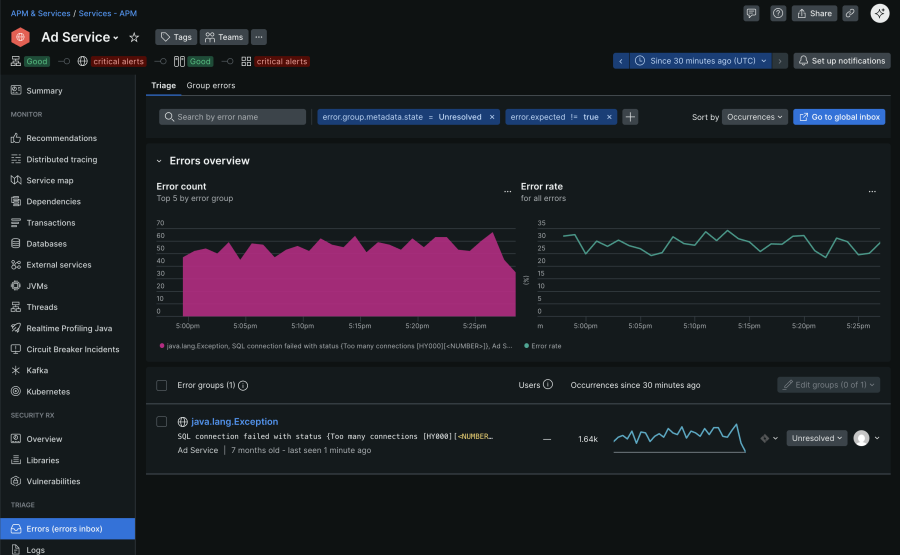
In high-velocity environments, scattered error alerts can slow teams down. Errors Inbox addresses this by consolidating errors across APM, browser, mobile, and serverless workloads into a single, structured view. Similar errors are automatically grouped to reduce noise, with metadata like stack traces, user impact, and deployment markers included for immediate context. Built-in filters by workload, version, and environment help teams spot regressions quickly, while collaboration features like triage states and integrations with Slack or Jira support shared ownership and faster resolution. The image below shows a typical errors inbox view for an "Ad Service," illustrating error trends and specific exceptions.

Learn more about responding to outages with error tracking in our documentation.
Distributed tracing
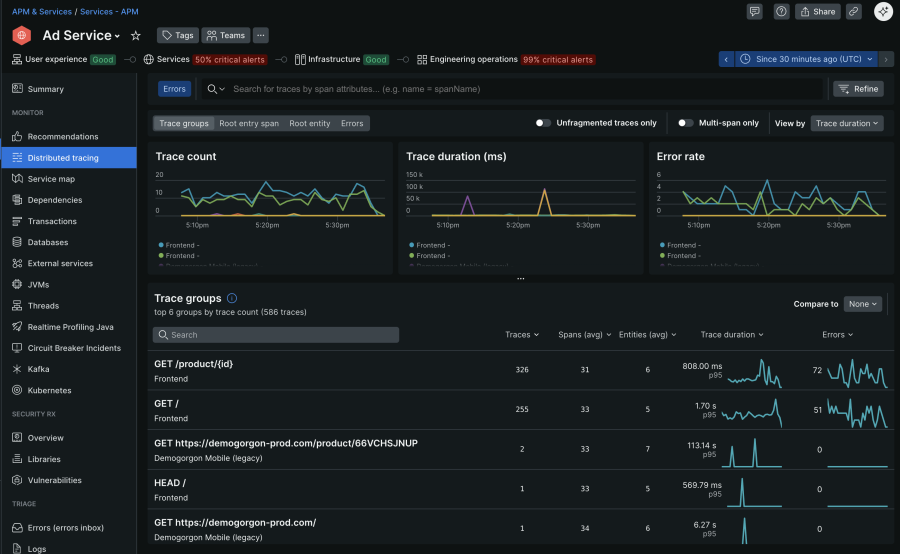
In complex, distributed systems, errors often occur far from where they appear. Distributed tracing captures the full journey of a request across microservices, backends, and external APIs, so teams can pinpoint where failures or latency spikes originate. When you filter for error traces, you can spot the specific service or span where the failure occurred, and inspect metadata like HTTP status codes or custom app tags. This cuts straight to the root cause, even when symptoms surface elsewhere. The image below shows distributed tracing UI of an “Ad Service” application in New Relic.

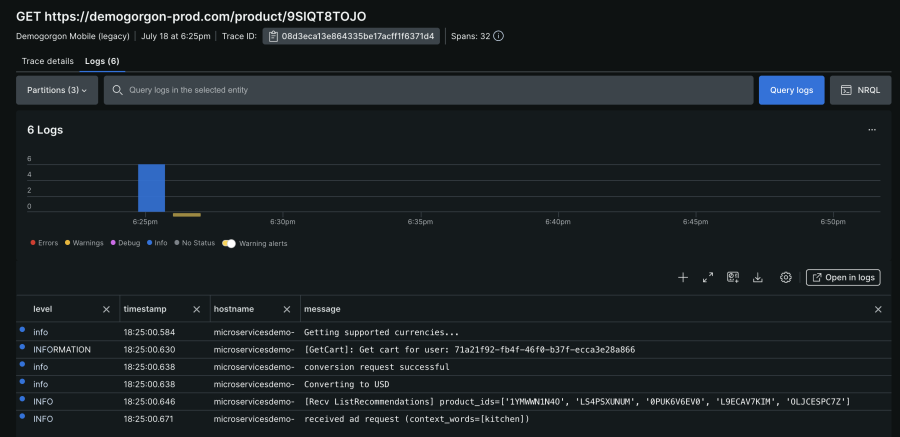
You can further drill down into any specific trace group to see the trace details or the Logs associated with it. The following image shows the “Logs” associated with an example trace in New Relic.

Logs in context
Logs by themselves only tell part of the story. With logs in context, New Relic connects your log entries directly to relevant UI views including APM summary, Errors Inbox, distributed traces, and infrastructure monitoring. Once enabled, your APM, Infrastructure, or OpenTelemetry agents automatically decorate logs with key metadata (like trace.id, span.id, hostname, and entity.guid). This makes it possible to view exactly which logs occurred during a specific trace or error without needing to query or cross-reference IDs manually.
In practice, you might be investigating a failed transaction and instantly see the related log entries embedded in that view, complete with enriched context. That reduces triage time and helps confirm root causes quickly. To see how logs in context can help you find the root cause of an issue in your apps and hosts, watch this short video (approx. 4:00 minutes):
Proactive error management strategies
Having the right tools is only part of the equation. Preventing incidents and responding effectively when they do occur, requires a shift in how teams approach reliability. It’s about turning observability into a day-to-day practice, not just something you reach for during a crisis.
From how teams track reliability goals to how they review incidents, proactive error management starts with habits. Below are a few strategies that help build that foundation:
- Define reliability with SLIs and error budgets
Set clear service-level indicators (SLIs) for reliability such as error rates, latency, and uptime. These SLIs should be supported by the error budgets that describe how much failure is tolerable before it affects delivery priorities. This helps teams make trade-offs consciously and align their work with business expectations around performance and stability. - Make errors easier to understand
When errors show up without context, you're left guessing. Adding custom attributes like user ID, request path, environment, or feature flag state, turn raw signals into something useful. These attributes show up automatically across traces, and logs making root cause analysis faster and more accurate. - Adopt intelligent alerting
Static thresholds often trigger noise or miss real problems. Instead, use anomaly detection or baseline alerts to flag unexpected changes in error rate or response time. Alerts should ideally be tied to user experience or SLI degradation, not arbitrary spikes. - Automate responses to common failures
For known error scenarios such as deployment rollbacks or service crashes, automate your response. Implement restart scripts, circuit breakers, or rollback routines triggered by predefined error conditions. Evidence shows automation can dramatically shorten resolution time and free teams to focus on complex issues - Iterate your observability setup regularly
Treat instrumentation and alerting as living artifacts. In retrospectives or sprint reviews, ask: Are alerts firing too often, or too late? Is crucial context missing from logs and traces? Adjust agents, dashboards, and alert rules as systems evolve.
Conclusion
Errors are inevitable. But extended outages, repeated failures, and slow recovery don’t have to be. By investing in structured error analysis, teams move faster, understand issues more clearly, and resolve them before they escalate. Tools like New Relic can play a critical role by connecting errors, traces, and logs into one workflow. But more importantly, it’s how teams use that data. Tracking trends, embedding context, sharing insight, and iterating on what works, that defines their resilience.
Proactive error management isn’t just a technical strategy. It’s how modern teams protect user experience, ship with confidence, and build systems that stay reliable under real-world conditions.
Próximos pasos
Modern systems demand more than reactive firefighting. Discover how tools such as New Relic support proactive observability and supports faster, smarter error resolution. To learn more, checkout these resources:
Las opiniones expresadas en este blog son las del autor y no reflejan necesariamente las opiniones de New Relic. Todas las soluciones ofrecidas por el autor son específicas del entorno y no forman parte de las soluciones comerciales o el soporte ofrecido por New Relic. Únase a nosotros exclusivamente en Explorers Hub ( discus.newrelic.com ) para preguntas y asistencia relacionada con esta publicación de blog. Este blog puede contener enlaces a contenido de sitios de terceros. Al proporcionar dichos enlaces, New Relic no adopta, garantiza, aprueba ni respalda la información, las vistas o los productos disponibles en dichos sitios.


