Quickstart
Why monitor Vertica?
Vertica is a high-performance, scalable data warehouse platform that is used by many organizations to store and analyze large datasets. However, like any complex system, Vertica can experience problems that can impact performance and reliability. Here are the top three reasons why Vertica needs to be monitored:
Data skew and segmentation:
Vertica distributes data across multiple nodes, and each node processes a subset of the data. If the data is not distributed evenly across the nodes, it can cause data skew, which can lead to performance problems. Segmentation is another problem that can occur when the data is not distributed evenly across the nodes. Segmentation can cause queries to take longer to run, as they have to wait for all of the nodes to finish processing their portion of the query.
Resource utilization:
Vertica is a resource-intensive platform, and it is important to monitor resource utilization to ensure that the system is not overloaded. Resources to monitor include CPU, memory, and disk I/O. If any of these resources are maxed out, it can lead to performance problems.
Query performance:
Vertica is designed to handle complex queries on large datasets quickly and efficiently. However, it is important to monitor query performance to ensure that queries are running as expected. If you notice that queries are taking longer to run than usual, it may be a sign of a performance problem.
Comprehensive monitoring quickstart for Vertica
Vertica Quickstart shows how to monitor a Vertica database and run simple queries to analyze the performance. As modern databases become increasingly complex yet crucial to business operations, it is imperative to continually monitor their performance. Vertica, a high-performance analytics database, provides several performance monitoring methods. You can monitor the activity and health of a Vertica database through log files and system tables.
What’s included in the Vertica quickstart?
Install this quickstart to get preconfigured observability solutions:
- Includes pre-built alert if the disk usage exceeds 90%
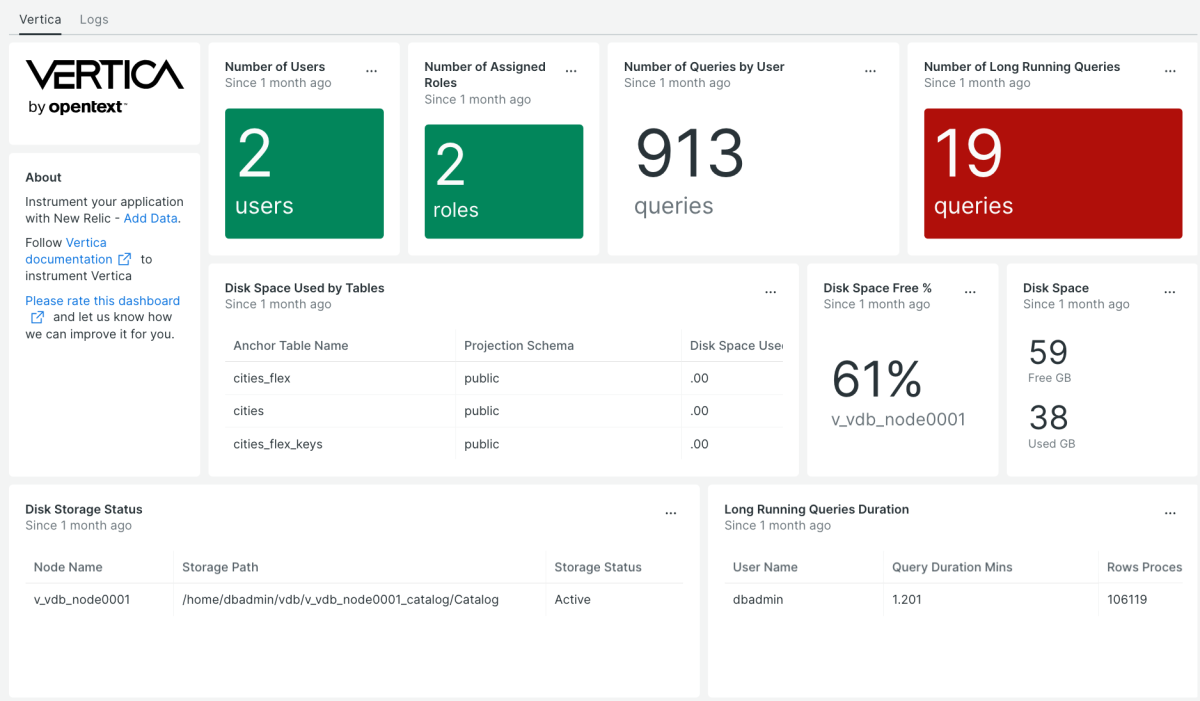
- Informative dashboards (long running queries, disk usage, user informations, sessions and more).
Need help? Visit our Support Center or check out our community forum, the Explorers Hub.


