Quickstart
Varnish Cache and why should you monitor it?
Varnish is a web cache used for content delivery and website acceleration. Media delivery over the internet can often experience lags and slow downs related to heavy user traffic and high throughput volumes. Varnish helps to address these issues by offering CDNs, streaming servers, caches, and HTTP/API reverse proxies that speed up the user experience. Caches such as Varnish are sensitive to things like insertion hits and misses and backend interactions, so it’s important to monitor such metrics to ensure Varnish runs smoothly.
New Relic Varnish quickstart highlights
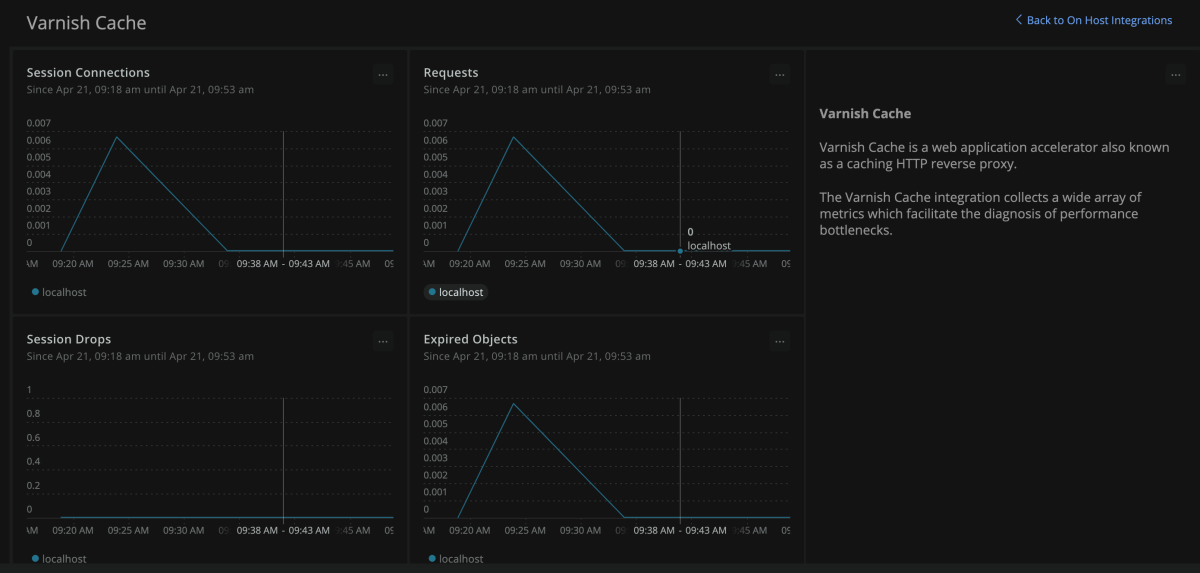
The New Relic Varnish quickstart provides a number of visual dashboards that display real-time insights into Varnish cache performance. These include:
- Session connections and drops
- Expired objects
- Requests
- Cache hits
- Cache misses
- Cache hits for misses and passes
- Cache grace hits
- And many more…
New Relic - The complete Varnish dashboard tool
New Relic enables cohesive Varnish monitoring. Varnish’s value is its ability to enhance the speed of backend requests and content serving; however, such value is negated by any performance issues that Varnish experiences. Having real-time insight into key Varnish metrics provided by New Relic is essential to keeping it running at peak capacity.
Dashboards, such as the ones on cache hits and misses, can help. Cache hits refer to successful requests to items in the Varnish cache. Conversely, cache misses are those requests which hit an empty cache and thus need to fetch data from the origin. Ideally, one should look to maximize cache hit rate, calculated as # of cache hits / total requests, and a hit rate of 95% or higher should be achievable. These two dashboards let you calculate this.
Need help? Visit our Support Center or check out our community forum, the Explorers Hub.


