Image
Quickstart
Comprehensive monitoring quickstart for Aerospike
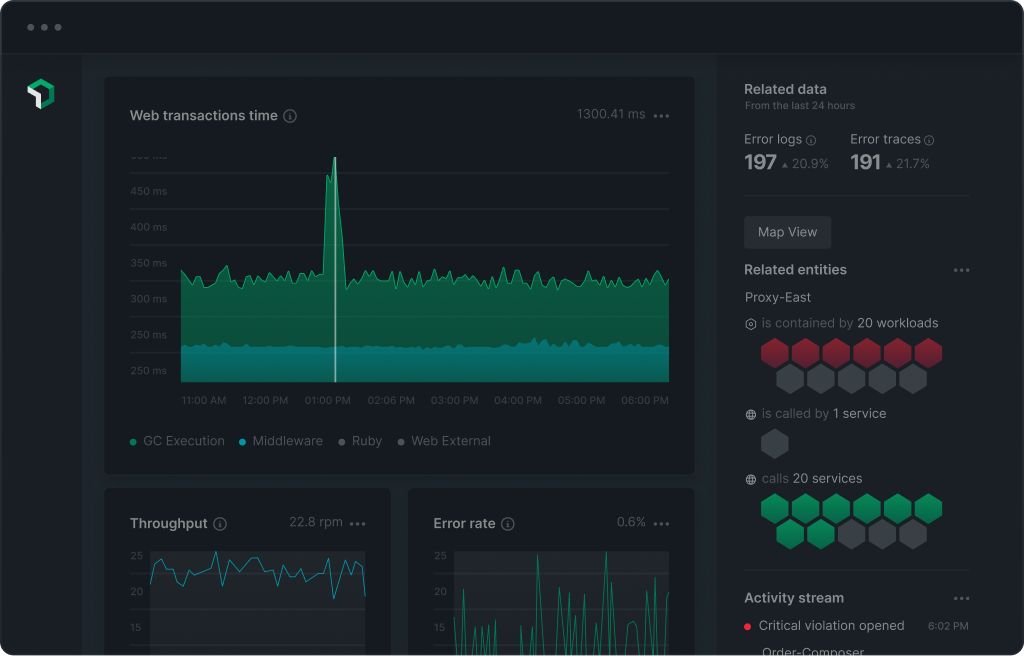
New Relic detects your Aerospike metrics like uptime, info stats, memory, client connections, etc. Monitor the performance metrics of your Aerospike instances in real-time with New Relic APM.
Why monitor Aerospike?
Using Aerospike database instrumentation, you can monitor cluster health, database performance, and alerts based on instantaneous and cumulative metrics.
What’s included in this quickstart?
New Relic Aerospike monitoring quickstart boasts instant full-stack observability out-of-the-box:
- Alerts for Aerospike (failed generation, unavailable partitions, uptime and heap efficiency %)
- Dashboards (uptime, info stats, memory, client connections, etc)
Authors
Support
BUILT BY NEW RELIC
Need help? Visit our Support Center or check out our community forum, the Explorers Hub.
Need help? Visit our Support Center or check out our community forum, the Explorers Hub.