Observing WebAssembly applications presents unique challenges that stem from its design and execution environment. Unlike traditional web applications, where monitoring tools can hook directly into JavaScript and the Document Object Model (DOM), WebAssembly runs as binary code executed within the browser's sandbox. This layer of abstraction complicates direct introspection, as traditional monitoring tools are not designed to interact with the lower-level operations of WebAssembly. The Bytecode Alliance plays a crucial role here, promoting standards and tools that aim to enhance the security and usability of WebAssembly, including better support for observability. Moreover, the performance characteristics of WebAssembly, which can closely approach native speeds, demand monitoring solutions that are both highly efficient and minimally invasive to avoid impacting the user experience. This creates a complex scenario for developers who need detailed visibility into their applications' behavior without sacrificing performance.
Blazor WebAssembly: Leveraging .NET in the browser
.NET Blazor WebAssembly is a cutting-edge framework that allows developers to build interactive client-side web UIs using .NET rather than JavaScript. By compiling C# code into WebAssembly, Blazor WebAssembly empowers developers to leverage the full-stack capabilities of .NET, utilizing the same language and libraries on both the server and client sides. This unique approach streamlines the development process and enables rich, responsive user experiences with significant performance benefits.
With the release of .NET 8, Blazor WebAssembly has introduced new rendering modes that enhance flexibility and performance across diverse deployment scenarios. These modes include:
- Static server rendering (also called static server-side rendering or static SSR) to generate static HTML on the server.
- Interactive server rendering (also called interactive server-side rendering or interactive SSR) to generate interactive components with prerendering on the server.
- Interactive WebAssembly rendering (also called client-side rendering or CSR, which is always assumed to be interactive) to generate interactive components on the client with prerendering on the server.
- Interactive auto (automatic) rendering to initially use the server-side ASP.NET Core runtime for content rendering and interactivity. The .NET WebAssembly runtime on the client is used for subsequent rendering and interactivity after the Blazor bundle is downloaded and the WebAssembly runtime activates. Interactive auto rendering usually provides the fastest app startup experience.
The auto rendering mode in particular make Blazor WebAssembly an even more compelling choice for developers who are looking to build modern web applications using .NET technologies.
This blog post focuses specifically on Blazor WebAssembly and explores its capabilities and practical applications in modern web development.
Enhancing Blazor WebAssembly observability with OpenTelemetry in .NET
In this exploration of Blazor WebAssembly, we delve into how OpenTelemetry (sometimes referred to as OTel) can be integrated with .NET to provide comprehensive observability for these applications. OpenTelemetry, a set of APIs, libraries, agents, and instrumentation, allows developers to collect and export telemetry data such as traces, metrics, and logs to analyze the performance and health of applications. For .NET developers, the integration with OpenTelemetry is particularly seamless, as all telemetry for .NET is considered stable, ensuring reliability and robust support across various deployment scenarios.
Exploring a sample Blazor WebAssembly application
In this blog post, we'll be utilizing a sample application that embodies the principles of Blazor WebAssembly combined with OpenTelemetry. The application, which can be found in the GitHub repository, serves as an excellent example of a standalone Blazor WebAssembly application. This practical example will serve as the foundation for our discussion on implementing and observing OpenTelemetry in a .NET environment. By dissecting this application, we can better understand the interaction between Blazor’s client-side component as a Blazor WebAssembly application running in the browser and a Blazor WebAssembly backend application that the web frontend talks to.
Automated and manual instrumentation of the backend
When deploying OpenTelemetry in a Blazor WebAssembly application, automated instrumentation becomes a pivotal component, particularly when interfacing with the .NET backend. OpenTelemetry's .NET libraries offer out-of-the-box instrumentation for ASP.NET Core, which effortlessly captures telemetry data such as HTTP requests, database queries, and much more. This automated process simplifies the task of implementing comprehensive monitoring, as it requires minimal manual configuration and coding. Additionally, integrating OpenTelemetry into your project is as straightforward as adding the respective NuGet packages to your solution.
For developers working with Blazor WebAssembly, this means enhanced visibility into the backend operations that power their applications. Automated instrumentation ensures that all relevant data transactions between the client and server are meticulously monitored, providing insights into performance metrics and potential bottlenecks. By leveraging this feature, developers can focus more on building features and less on the intricacies of setting up and maintaining observability infrastructure, making it easier to deliver high-performance, reliable applications.
The project file for the .NET Blazor WebAssembly backend looks like this (you can find the full project file in the repository):
'''dotnet <PackageReference Include="OpenTelemetry.Exporter.OpenTelemetryProtocol" Version="1.8.0" /> <PackageReference Include="OpenTelemetry.Instrumentation.EntityFrameworkCore" Version="1.0.0-beta.9" /> <PackageReference Include="OpenTelemetry.Instrumentation.Runtime" Version="1.8.0" /> <PackageReference Include="OpenTelemetry" Version="1.8.0" /> <PackageReference Include="OpenTelemetry.AutoInstrumentation.Runtime.Native" Version="1.5.0" /> <PackageReference Include="OpenTelemetry.Exporter.Console" Version="1.8.0" /> <PackageReference Include="OpenTelemetry.Extensions.Hosting" Version="1.8.0" /> <PackageReference Include="OpenTelemetry.Instrumentation.AspNetCore" Version="1.8.1" /> <PackageReference Include="OpenTelemetry.Instrumentation.Http" Version="1.8.1" /> '''

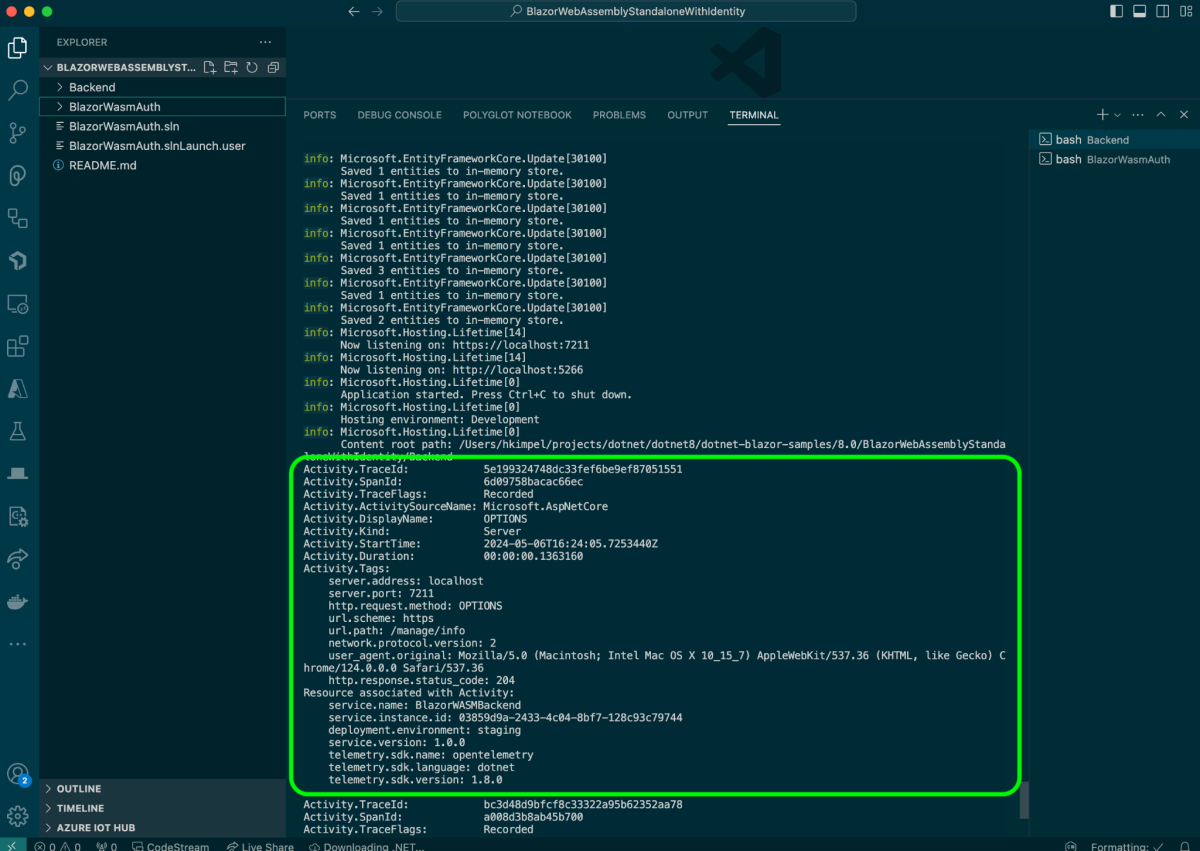
When running the Blazor backend with automated OpenTelemetry instrumentation and exporting the telemetry to the console, we can easily see the traces, metrics, and logs as part of the console output (here in VS Code terminal).

But looking at telemetry such as traces, metrics, and logs in the console output is not really helpful. So, ideally, we want to export that data to an OpenTelemetry telemetry backend. I am of course using New Relic.
In a typical OpenTelemetry fashion, I only need to provide a few environment variables when executing the application. I highlighted the most important ones in the below screenshot. You can find the full run script in the repository.

Once the application is up and running, you find the application entity in APM & Services under the OpenTelemetry section. The screenshot below shows the Summary view.

Distributed Tracing view:

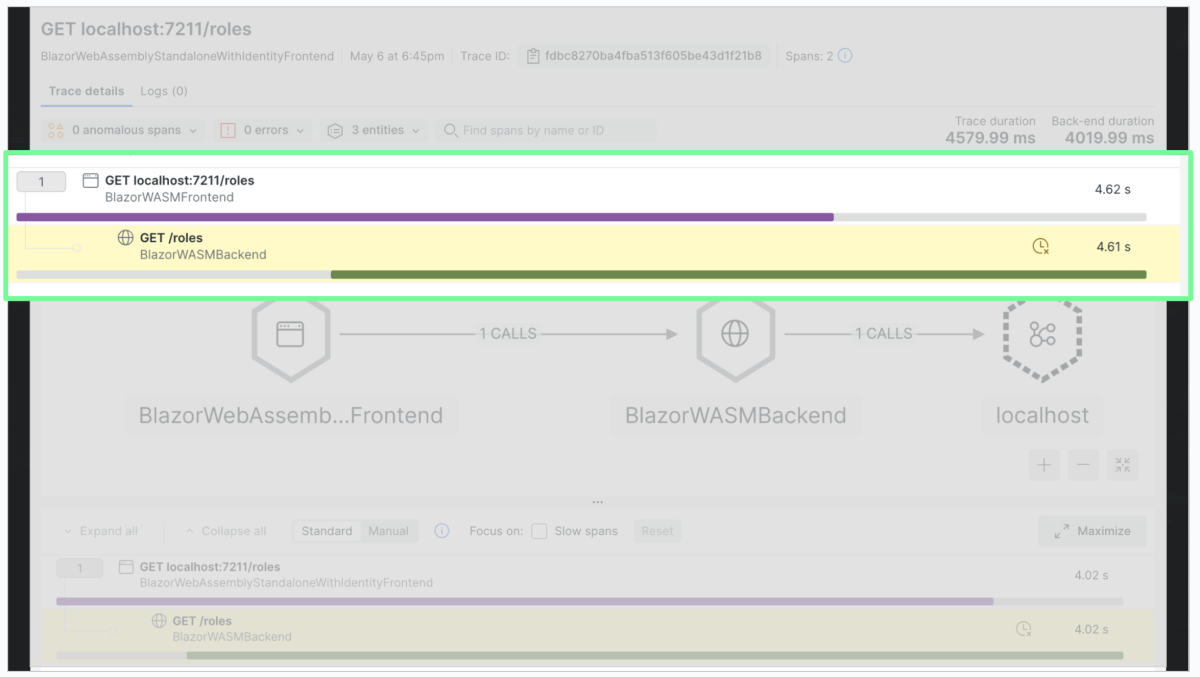
View of a single trace (I highlighted the backend span to /roles endpoint):

When you look at the above span to the BlazorWASMBackend service GET /roles, you’ll notice that the total time spent in the backend span is 4.61s. We cannot really tell where exactly the time is spent. Out of the box, when using auto instrumentation, I don’t get further detail into what is actually happening in that method.
In order for me to provide more details into that method, I’ll need to add some manual instrumentation into my source code by leveraging the OpenTelemetry SDK for .NET.
In this case, I changed the original code of the app.MapGet("/roles", … method from this original implementation:
           // Instantiate random number generator using system-supplied value as seed.
           var rand = new Random();
           int waitTime = rand.Next(500, 5000);

           // do some heavy lifting work
           Thread.Sleep(waitTime);
and added in some .NET-specific implementation of a custom OpenTelemetry span:
           // Instantiate random number generator using system-supplied value as seed.
           var rand = new Random();
           int waitTime = rand.Next(500, 5000);


           using (var sleepActivity = DiagnosticsConfig.ActivitySource.StartActivity("RolesHeavyLiftingSleep"))
           {
               // do some heavy lifting work
               Thread.Sleep(waitTime);


               string waitMsg = string.Format(@"ChildActivty simulated wait ({0}ms)", waitTime);
               sleepActivity?.SetTag("simulatedWaitMsg", waitMsg);
               sleepActivity?.SetTag("simulatedWaitTimeMs", waitTime);
               DiagnosticsConfig.logger.LogInformation(eventId: 123, waitMsg);
           }
The using-block actually triggers a new span to be created with the name RolesHeavyLiftingSleep. I save the activity into the sleepActivity variable. You’ll further notice that I’m also adding some custom tags to that same activity by calling sleepActivity?.SetTag().
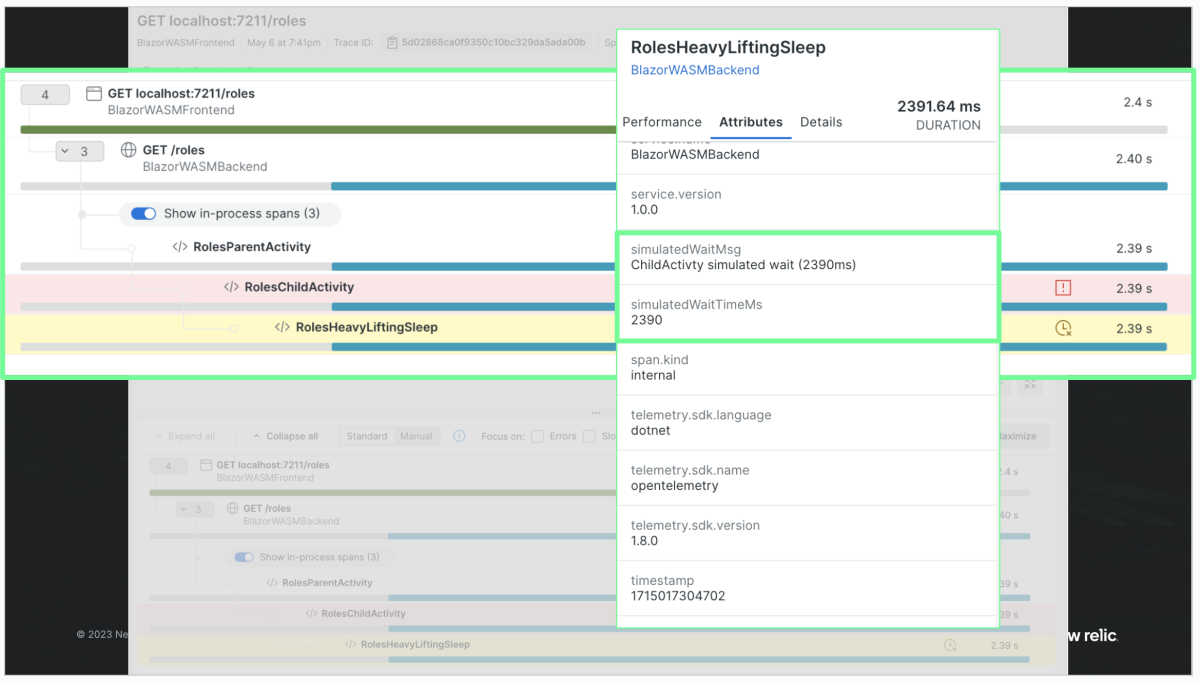
We can see in the screenshot below what the result of that change looks like if we restart our application.

The trace in the screenshot above allows me to drill deeper into the backend span by enabling the in-process spans. In here, we can see that there’s a RolesParentActivity, followed by a RolesChildActivity, and finally our RolesHeavyLiftingSleep span from our manual instrumentation. This screenshot also shows a section of the attributes that are associated with that span. As you can see, the custom tags simulatedWaitTimeMs and simulatedWaitMsg are visible as well. These custom tags are potentially helpful when doing some root cause analysis or troubleshooting.
Instrumentation of the frontend
Now that we’ve seen how the backend can be instrumented with OpenTelemetry, let’s focus on the frontend now, that is, the Blazor WebAssembly component.
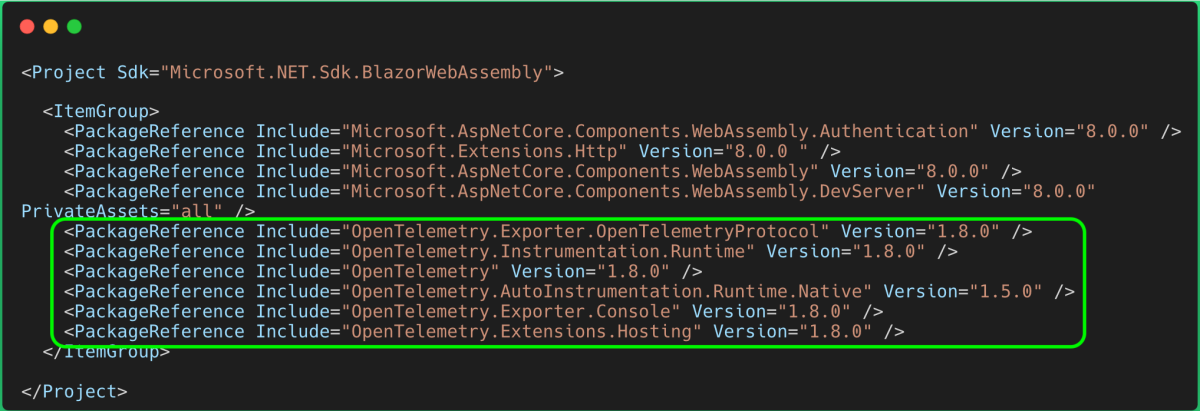
When we try to instrument the WebAssembly component with auto instrumentation for OpenTelemetry, the C# project file looks similar to the backend. This is actually the benefit of Blazow WebAssembly—that we can use C# not only for the backend, but also for the WebAssembly frontend.

Let’s configure the console exporter again for our OpenTelemetry telemetry. Unsurprisingly, the output will be visible in the respective developer tools of our web browser.

The screenshot above shows the actual UI of the Blazor WebAssembly frontend in the upper section of the screenshot. If the user of the application clicks the Click me button, a trace is generated and output in the browsers console view.
Again, this is adequate for testing, but in order to actually leverage the telemetry in a meaningful way, we need to export all telemetry to an OpenTelemetry backend, in my case New Relic. For this to happen, we need to define an OpenTelemetry protocol (OTLP) exporter and configure the OTLP endpoint as well as the OTLP header information similar to what we’ve seen for the backend.
But wait; as soon as we implement these changes and rerun the application, an exception is generated.

The exception is Operation is not supported on this platform. If we think about it, it does make sense since we’re trying to make a HTTP request from our WebAssembly component to an external endpoint. However, since WebAssembly by itself doesn't have any access to its host environment, it doesn't have any built-in input/output (I/O) capabilities. For security reasons, it’s not possible to make HTTP requests from within a WebAssembly component.
So, if plain OpenTelemetry instrumentation isn’t possible, what is it that we can do for the frontend then?
As part of OpenTelemetry, the community is also working on some real user monitoring capabilities.

However, this is very early stages and not fully spec’d out. The current draft is also only focusing on Node.js and TypeScript. In the future this may be an option that could be leveraged for the frontend component.
One way to get details of the WebAssembly component is to leverage real user monitoring capabilities via the New Relic browser.
After getting the JavaScript snippet from a newly created New Relic browser application copied into the Blazor WebAssembly project (this is the place to put it), we can already see some high-level telemetry from the frontend.

Distributed tracing view:

AJAX requests:

What else can we do with the frontend? Some parts of the frontend will have interactions with the backend (like login and logout authentication). Other parts just execute code within the WebAssembly component. An example of this is the Counter section.

As you can see in the page source of that page, there’s no actual HTML representation.

Let’s see what we can do there.
One way is to invoke JavaScript functions from the actual .NET code. The following screenshot shows how this can be achieved (here is the link to the respective file in the repository).

The New Relic browser API allows users to add some custom page actions. This way we can observe all clicks on the counter and also capture the current value of the counter as a custom attribute.
Once we’ve implemented this and deployed a new release of the application, we can for example show this data on a custom dashboard to see the distribution of the actual counter values across all users of the application.

Furthermore, New Relic quickstarts, also known as Instant Observability, contain a sample dashboard that you can deploy into your account in order to see some additional Blazor WebAssembly specific telemetry in a pre-built dashboard.

Próximos passos
Observing Blazor WebAssembly applications is not quite straightforward as of today. There are many moving parts that the industry and the respective open-source communities are working on. This applies to the WebAssembly component model, as well as the OpenTelemetry implementation of real user monitoring. I think these challenges will soon be solved and there will be easier ways to get started.
Until then, in this blog post I showed a way to get some insights into your Blazor WebAssembly backend and frontend components.
New Relic provides a [free account](https://newrelic.com/signup) that you can use to get started with your journey on observing Blazor WebAssembly applications.
As opiniões expressas neste blog são de responsabilidade do autor e não refletem necessariamente as opiniões da New Relic. Todas as soluções oferecidas pelo autor são específicas do ambiente e não fazem parte das soluções comerciais ou do suporte oferecido pela New Relic. Junte-se a nós exclusivamente no Explorers Hub ( discuss.newrelic.com ) para perguntas e suporte relacionados a esta postagem do blog. Este blog pode conter links para conteúdo de sites de terceiros. Ao fornecer esses links, a New Relic não adota, garante, aprova ou endossa as informações, visualizações ou produtos disponíveis em tais sites.


