Ashley Jeffs is a guest contributor from Timber.io. Julian Giuca, a Senior Director and Product GM at New Relic, also contributed to this post.
The success of your observability practice depends on the quality of the data you collect from your systems—and today, your systems are producing all kinds of metrics and logs. You could gather this data in a handful of different ways by managing a handful of different tools, but these tools are complex, and reducing complexity is a huge win for your overall architecture.
This is exactly why the New Relic Logs team recently partnered with Timber.io to add a New Relic Logs integration to Vector—a monitoring and observability data router that collects and transforms metrics and log data from a wide range of sources, including as StatsD, Syslog, Docker, and Kafka. Now all this critical data can be collected and analyzed on the New Relic One platform.
Read on to learn more about how this integration works.
What is Vector?
Vector is a lightweight and ultra-fast open source tool for building observability pipelines. With Vector, you can add transforms that automatically enrich your logs and metrics with useful environment metadata. For example, the Vector EC2 metadata transform enriches logs from EC2 with instance_id, hostname, region, vpc_id, and more.
Here are the key components of a Vector observability pipeline:
- Sources: Define where Vector should pull data from, or how it should receive data pushed to it. A pipeline can have any number of sources, and as they ingest data they proceed to normalize it into “events.”
- Events: All logs and metrics that pass through a pipeline are described as events. (Check out Vector's data model docs for more about events.)
- Transforms: Mutate events as they’re transported by Vector, via parsing, filtering, sampling, or aggregating. You can have any number of transforms in your pipeline, and compose them however you want.
- Sinks: Create a destination for events. Each sink's design and transmission method is dictated by the downstream service it interacts with. For example, the New Relic logs sink, batches Vector log events to New Relic's log service via the logging API.
Getting Started with Vector’s New Relic Logs integration
The New Relic Logs integration is included in Vector. To get started pushing metrics and logs to New Relic, you simply need to install Vector and configure the New Relic Logs sink.
You can install Vector on a number of Linux operating systems, as well as MacOS, Windows, and Raspbian.
This example uses the Linux-based install script:
curl --proto '=https' --tlsv1.2 -sSf https://sh.vector.dev | sh
The installation creates a configuration file at /etc/vector/vector.toml. From here you need to specify a source (e.g., Vector’s stdin source) and add the new_relic_logs sink.
Note: To set up the new_relic_logs sink, you'll need your New Relic license key.
Add the following in /etc/vector/vector.toml:
[sources.stdin]

  type = "stdin"


[sinks.new_relic]

  type = "new_relic_logs"

  inputs = ["stdin"]

  license_key = "<YOUR LICENSE KEY>"
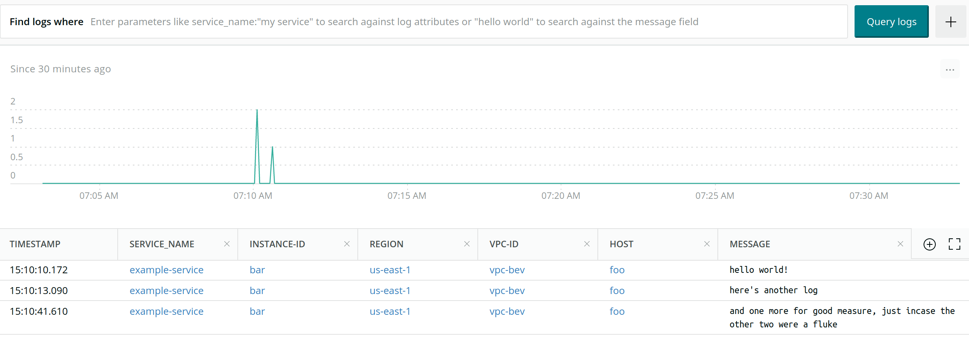
Finally, run Vector. Since we configured this example to use the stdin source, any lines we write will be sent to the new_relic_logs sink, which will populate in New Relic Logs. For example:
$ vector -c ./vector.toml

hello world!

That's it—we've sent logs from an stdin source to New Relic using a Vector pipeline.
To learn more, check out the New Relic Logs Sink documentation. Join the Nerdlog discussion every Thursday at 12 p.m. PT on Twitch or keep up to date with our Nerdlog on your own like our Heroku integration article.
이 블로그에 표현된 견해는 저자의 견해이며 반드시 New Relic의 견해를 반영하는 것은 아닙니다. 저자가 제공하는 모든 솔루션은 환경에 따라 다르며 New Relic에서 제공하는 상용 솔루션이나 지원의 일부가 아닙니다. 이 블로그 게시물과 관련된 질문 및 지원이 필요한 경우 Explorers Hub(discuss.newrelic.com)에서만 참여하십시오. 이 블로그에는 타사 사이트의 콘텐츠에 대한 링크가 포함될 수 있습니다. 이러한 링크를 제공함으로써 New Relic은 해당 사이트에서 사용할 수 있는 정보, 보기 또는 제품을 채택, 보증, 승인 또는 보증하지 않습니다.


