In the Greek mythology of the Titans, Prometheus brought fire to humanity. Then the CNCF brought Prometheus to open source users around the world.
Now, we’ve brought Prometheus to New Relic.
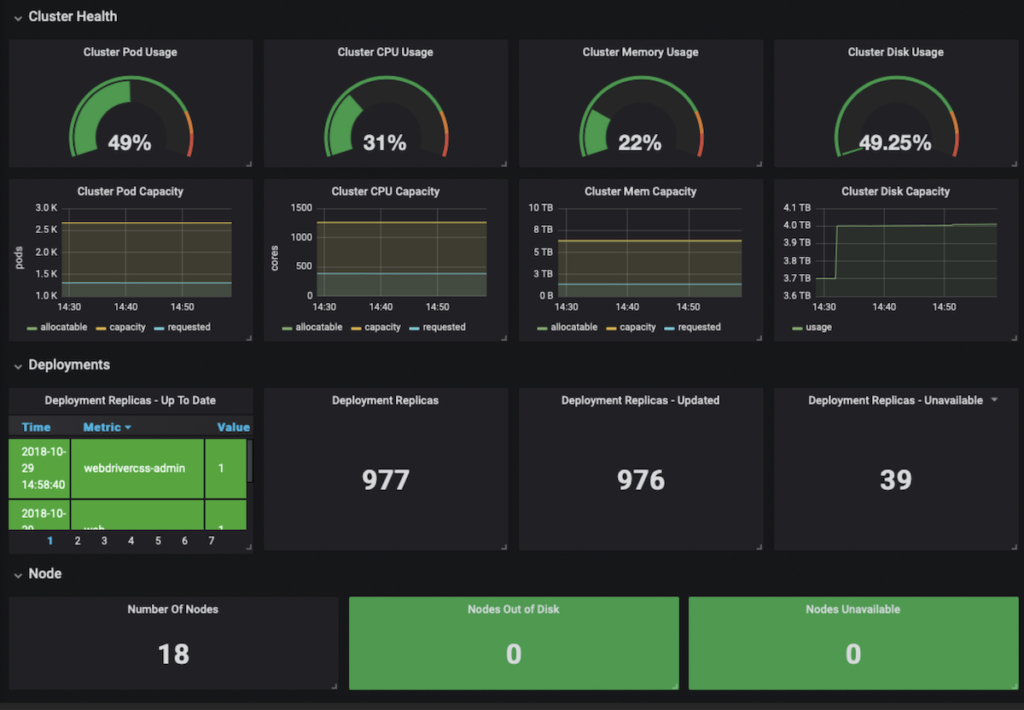
We know your infrastructure metrics are important, and we know Prometheusis an essential tool for many of you. Its popularity is obvious: it’s easy to install; it’s the standard metrics tool for Kubernetes; it integrates seamlessly with Grafana; and it’s got an active developer and user community.
Nevertheless, we also know it’s not a one-size-fits-all experience. Small teams looking to grow with their business have trouble managing and scaling their Prometheus deployments and can’t justify the expense of vendor-managed solutions. Enterprise teams with complex systems and large volumes of telemetry data are using multiple, siloed instances of Prometheus and Grafana, which too often increases mean time to detection and resolution when issues arise.
Add on limitations around availability and scale, and Prometheus can quickly become an operational burden.
Prometheus is here to stay, but we can overcome its limitations. This is why we’ve made the Prometheus remote write integration and Grafana support a key part of the New Relic Telemetry Data Platform. And it’s absolutely free to use starting today.
Standard Prometheus environments vs. New Relic’s Telemetry Data Platform
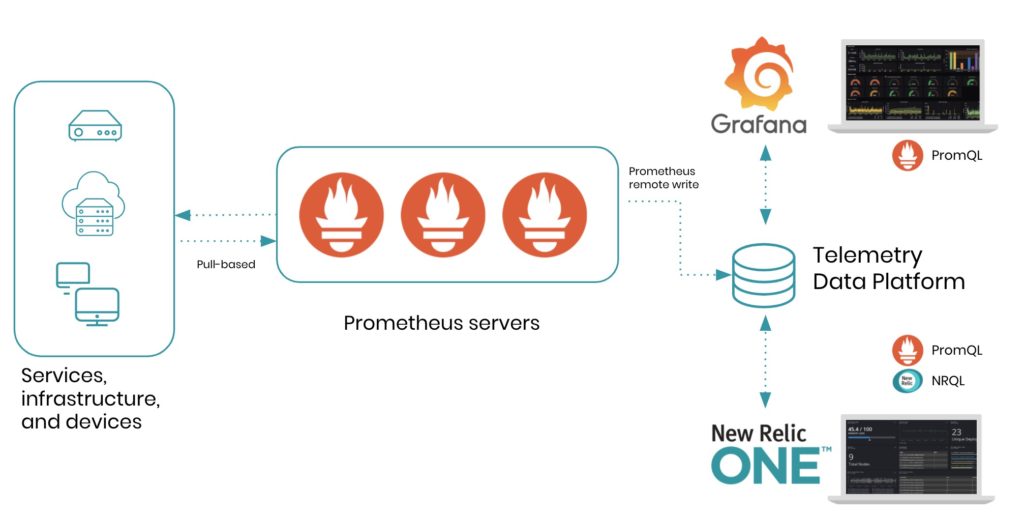
The Telemetry Data Platform is a fully managed, elastic, time series platform that can store all your open source, vendor-specific, or vendor-agnostic telemetry data in one place. Built to achieve massive scale, it’s extremely powerful and capable of querying terabytes of data with millisecond response times.
Prometheus’ built-in remote write capability forwards metrics from your existing Prometheus servers to the Telemetry Data Platform. Once your metrics are in the Telemetry Data Platform, you instantly benefit from 13 months of retention and on-demand scalability. With all of your telemetry data in one place, you can build dashboards that combine and group data from across your entire software stack. Now, you’ll enjoy a fully connected, global view of the relationships between all your data sources—from Prometheus metrics to application logs to distributed traces between microservices.
In terms of reducing limitations, consider the following:
| Your Needs | Standard Prometheus | With New Relic |
|---|---|---|
| Your NeedsData durability | Standard PrometheusDefaults to 15 days of retention; older data is deleted | With New Relic 13 months of retention |
| Your NeedsScalability | Standard PrometheusDoes not scale horizontally; memory usage is proportional to the amount of stored data, and as data grows, you’ll hit node memory limits | With New Relic Scalable multi-tenant architecture |
| Your NeedsGlobal views of data | Standard PrometheusLack of seamless and efficient data integration between nodes; requires multiple Grafana instances to access data between nodes or additional bolt-on solutions | With New Relic Storage of all data—Prometheus and otherwise—in a single, unified database; query data from New Relic or using Grafana |
| Your NeedsEase of management | Standard PrometheusArchitecture is complex and requires a DIY mentality, and domain expertise in order to set up, configure, and operate correctly | With New Relic Setup in just minutes, with New Relic’s Prometheus and Grafana integrations |
| Your NeedsSecurity | Standard PrometheusLacks enterprise-grade and basic security capabilities; adding security requires additional tools and ongoing maintenance | With New Relic Built-in enterprise-grade security for all data and all users |
About the Prometheus remote write integration
Unlike our Prometheus OpenMetrics integration—which is intended for customers new to Prometheus or without a mature Prometheus environment—the Prometheus remote write integration is for those of you who want to continue to run your own Prometheus environments but still send data to the Telemetry Data Platform.
After you configure remote write in your Prometheus YAML file, Prometheus data will begin flowing into the Telemetry Data Platform almost instantly. To visualize the data, you have two options:
- Within New Relic’s UI: Use New Relic Query Language (NRQL) or PromQL-style mode in chart builder (explained below), as well as dashboards and custom applications.
- Within Grafana: Configure the Data Platform as a Prometheus data source in Grafana.
How to configure the Prometheus remote write integration
Before you get started, make sure you’re running Prometheus versions 2.15.0 or newer.
To set up Prometheus remote write, navigate to Instrument Everything - US or Instrument Everything - EU, click the Prometheus tile, and complete the following steps:
- Enter a name for the Prometheus server you’re connecting to and generate your
remote writeURL. Note: The name you enter for the server will create an attribute on your data, and will be the name used to identify which Prometheus server you're connecting to. - Copy and add the generated
remote writesnippet (with URL) to your Prometheus YAML file. For example:
Remote_write:

- url:

https://metric-api.newrelic.com/prometheus/v1/write?X-License-Key=<YOUR_LICENSE_KEY>&prometheus_server=<YOUR_DATA_SOURCE_NAME>

remote_timeout: 15s
- Restart your Prometheus server.
- From here, you can view your data directly in New Relic or in Grafana.
For details on customizing remote write behavior, check out the documentation.
How to configure New Relic as a Prometheus data source in Grafana
When you set up the Prometheus remote write integration and configure the Telemetry Data Platform as a Prometheus data source in Grafana, you can use PromQL-style syntax to populate your existing Grafana dashboards with Prometheus data stored in New Relic.
Note: We do our best to translate PromQL queries coming from Grafana to the nearest equivalent expression in NRQL but some query results may differ. Learn more about our supported PromQL features.
You’ll need Grafana version 6.7.0 or higher.
- In New Relic, create a new X-Query key.
- From the Grafana Home screen, go to Configuration > Data Sources and click Add data source.
- From the Add data source screen under Time series databases options, select Prometheus.
- Enter the Name you want to use for your new Prometheus data source.
- Set the Default toggle to the on or off position, depending on whether you want this to be your default data source for Prometheus queries.
- Off: this is not your default data source
- On: this is your default data source
- Enter the correct URL:
- Under Custom Headers, select Add Header. Enter X-Query-Key and the key you created in step 1.
- For HTTP Method select
GET. - Click Save & Test.
For more configuration information, check out the documentation.

PromQL to NRQL translation in the Telemetry Data Platform
We know learning a new language, like NRQL, can be a big lift, and you’ve likely developed expertise with PromQL. To ease your transition, we’ve built a translator that lets you write PromQL-style syntax, which we convert into NRQL queries. From chart builder, select PromQL-style and enter your query.
Currently, we support a handful of aggregation, arithmetic, mathematical, and rate-like functions, but we plan on building our support for PromQL over time.
Refer to our supported PromQL documentation to learn more.
Power your Prometheus data with the Telemetry Data Platform
With the Telemetry Data Platform, you get one unified place to ingest, analyze, visualize, and alert on metrics, events, logs, and traces from any source, including Prometheus. With the remote write integration, you can eliminate the cost and complexities of hosting and operating additional servers and datastores, and ensure your Prometheus data is sent to a database built to handle your biggest days.
Sign up for 100GB of ingest per month and one Full-Stack Observability user license—free forever! And get started with the Prometheus and Grafana integrations today.
이 블로그에 표현된 견해는 저자의 견해이며 반드시 New Relic의 견해를 반영하는 것은 아닙니다. 저자가 제공하는 모든 솔루션은 환경에 따라 다르며 New Relic에서 제공하는 상용 솔루션이나 지원의 일부가 아닙니다. 이 블로그 게시물과 관련된 질문 및 지원이 필요한 경우 Explorers Hub(discuss.newrelic.com)에서만 참여하십시오. 이 블로그에는 타사 사이트의 콘텐츠에 대한 링크가 포함될 수 있습니다. 이러한 링크를 제공함으로써 New Relic은 해당 사이트에서 사용할 수 있는 정보, 보기 또는 제품을 채택, 보증, 승인 또는 보증하지 않습니다.


