What is AWS Lambda logging?
AWS Lambda logging lets you capture and store information about the execution of functions in AWS Lambda. When you create and deploy a serverless function on AWS Lambda, it's important to have visibility into its behavior, performance, and errors. Logging allows you to monitor and troubleshoot your Lambda functions effectively.
Here are some key aspects of AWS Lambda logging:
- CloudWatch logs: AWS Lambda integrates with Amazon CloudWatch Logs, a scalable log storage service. Lambda automatically streams its logs to CloudWatch Logs. You can view, search, and analyze these logs using the CloudWatch console, SDKs, or the AWS Command Line Interface (CLI).
- Logging libraries: When writing Lambda functions, you can include logging statements in your code using logging libraries like console.log in Node.js, print in Python, or similar statements in other supported languages. These statements generate log entries that are sent to CloudWatch Logs.
- Logging levels: Logging statements often include a severity or logging level (e.g., info, warning, error) to categorize the importance of the log message. You can use these levels to filter and identify issues in your Lambda function.
- Custom metrics: In addition to standard logs, Lambda allows you to emit custom metrics directly to CloudWatch Metrics. This enables you to track specific performance indicators and custom events beyond standard logging.
- Retrieval and analysis: CloudWatch Logs provide tools for searching and filtering logs, making it easier to identify patterns or troubleshoot issues. You can also set up alarms based on log metrics to get notified when certain conditions are met.
However, the fees for sending AWS Lambda function logs to Amazon CloudWatch can add up quickly after you’ve exceeded the limits of their free tier, especially for frequently invoked functions that produce even relatively moderate quantities of log data. You could use New Relic for log analysis, but until recently our solution relied on Amazon CloudWatch to ingest Lambda logs and then forward them to New Relic.
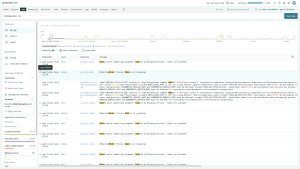
With the AWS Lambda Extensions Logs API, Lambda Extensions now have direct access to the log stream, independent from CloudWatch. And you can take advantage of the newest version of the New Relic Lambda extension to send function logs, in addition to telemetry data, directly to New Relic One to gain unified visibility into your Lambda functions. (Lambda extensions are a new way for observability and other tools to easily integrate with AWS Lambda.)
How does an engineer benefit? You can manage and optimize your cloud spend without compromising observability by sending Lambda function logs directly to New Relic One’s Telemetry Data Platform. In this post, I’ll explain how to configure this, and in my next post we’ll dig deeper into what you can do with New Relic’s Lambda extension, and how it helps you use New Relic One to better understand the behavior and performance of serverless applications hosted in AWS Lambda.
How to configure Lambda logging
Configuring this for your functions that already use the extension to send telemetry data is straightforward. You simply change one environment variable and remove the CloudWatch subscription filter. Here’s an example of what that looks like in AWS CloudFormation, using our Go example function:
Resources:

  NewRelicExample:

    Type: AWS::Serverless::Function

    Properties:

      CodeUri:

        Bucket: !Sub newrelic-example-${AWS::Region}-${NRAccountId}

        Key: go-example.zip

      Description: A simple Lambda, with New Relic telemetry

      FunctionName: newrelic-example-go

      Handler: handler

      Runtime: provided

      Environment:

        Variables:

          NEW_RELIC_ACCOUNT_ID: !Sub ${NRAccountId}

          NEW_RELIC_TRUSTED_ACCOUNT_KEY: !Sub ${NRAccountId}

          # Enable the new logging functionality

          NEW_RELIC_EXTENSION_SEND_FUNCTION_LOGS: true

      Layers:

        # This layer includes the New Relic Lambda Extension, a sidecar process that sends telemetry

        - !Sub

arn:${AWS::Partition}:lambda:${AWS::Region}:451483290750:layer:NewRelicLambdaExtension:5

      # The section below disables CloudWatch entirely, and is optional.

      Role: !GetAtt FunctionRole.Arn

  FunctionRole:

    Type: AWS::IAM::Role

    Properties:

      AssumeRolePolicyDocument:

        Version: "2012-10-17"

        Statement:

          - Effect: Allow

            Principal:

              Service: "lambda.amazonaws.com"

            Action: sts:AssumeRole

      ManagedPolicyArns:

        - !ImportValue

NewRelicLicenseKeySecret-NewRelic-ViewLicenseKeyPolicyARN
In the above example, we set the value to true for using the NEW_RELIC_EXTENSION_SEND_FUNCTION_LOGS environment variable to send function logs. This is all that is necessary to turn on the functionality. Be sure, however, to turn off the subscription filter for your function as well using our CLI tool. If you forget this step, your logs will be sent to New Relic twice, which could be confusing.
newrelic-lambda subscriptions uninstall --function <name> --aws-region <region>
The section at the bottom of the above template regarding the function’s execution role removes the default CloudWatch permissions. This prevents the function from logging to CloudWatch, which eliminates CloudWatch ingest fees for that Lambda function. It’s best to test that your New Relic logging integration is working correctly before disabling CloudWatch, so you don't lose visibility into your function’s execution.
Because sending Lambda function logs directly to New Relic is configured on a per-function basis, you can easily transition from the old mechanism for log ingestion to the new one at your own pace, and reduce your cloud spend as you go.
Get full visibility into your Amazon Web Services environments with a free observability plan from New Relic on AWS Marketplace.
AWS Lambda Logging Best Practices
Effective logging is crucial for monitoring and troubleshooting AWS Lambda functions. Here are some best practices for AWS Lambda logging:
Use logging libraries:
Leverage the logging libraries provided by the runtime environment (e.g., console.log in Node.js, print in Python). These statements generate log entries that are sent to CloudWatch Logs.
Include sufficient information:
Include relevant information in your log messages, such as function inputs, outputs, timestamps, and contextual details. This helps in understanding the flow of execution and diagnosing issues.
Handle errors appropriately:
Ensure that your Lambda functions include proper error-handling mechanisms. Log detailed error messages, stack traces, and any relevant information to help identify and troubleshoot issues.
Monitor cold starts:
Be aware of cold starts (initialization of a new execution environment) and monitor their impact on function performance. Cold starts can introduce latency, and logging can help you analyze their frequency and duration.
Centralized logging:
Consider using centralized logging solutions or log aggregation tools such as New Relic to collect logs from multiple sources, including Lambda functions. This can simplify log analysis and troubleshooting in larger environments.
Regularly review and analyze logs:
Regularly review and analyze logs to proactively identify trends, anomalies, or potential issues. This helps you address problems before they impact the performance or reliability of your applications.
Learn more about installing and configuring the CloudWatch logs Lambda function with New Relic.
이 블로그에 표현된 견해는 저자의 견해이며 반드시 New Relic의 견해를 반영하는 것은 아닙니다. 저자가 제공하는 모든 솔루션은 환경에 따라 다르며 New Relic에서 제공하는 상용 솔루션이나 지원의 일부가 아닙니다. 이 블로그 게시물과 관련된 질문 및 지원이 필요한 경우 Explorers Hub(discuss.newrelic.com)에서만 참여하십시오. 이 블로그에는 타사 사이트의 콘텐츠에 대한 링크가 포함될 수 있습니다. 이러한 링크를 제공함으로써 New Relic은 해당 사이트에서 사용할 수 있는 정보, 보기 또는 제품을 채택, 보증, 승인 또는 보증하지 않습니다.


