Engineers working with serverless cloud-based architectures report “‘debugging”’ and other observability challenges as their top concerns, over cost controls and understanding architectural complexity. While serverless has eliminated many of the operations problems engineers faced in the past, the challenge of effectively monitoring and understanding issues remains significant, especially in a system where it’s easy for small teams to deliver production microservices.
Today, these challenges are lessened with Amazon Web Services (AWS) announcing the release of the Lambda Runtime Logs API, which allows extensions to access logging data from AWS Lambdas and the Lambda execution environment. Concurrently, New Relic is releasing updates to support the Logs API in our Lambda monitoring toolkit.
The Logs API allows extensions to subscribe to three different logs streams:
- Function logs, which are generated by the Lambda function and written to or emitted as messages
- Platform logs generated by the Lambda platform (such as the START, END, and REPORT lines), and
- Extension logs, which are produced by extension code
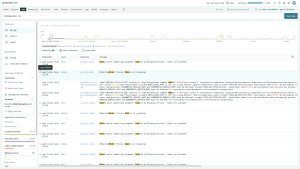
The New Relic extension will use the Logs API to bring feature parity with a solution that monitors Amazon CloudWatch for logged events. The result is a cleaner install path to allow New Relic to monitor serverless compute applications.
There are multiple paths to implementation using AWS Lambda’s extensions and the Logs API. New Relic’s implementation of the integration uses the execution time available during function execution to improve the time data takes to reach your dashboard. New Relic’s approach is highly optimized for platform logs, ingesting data on your Lambda’s performance with minimal latency and cost.
In this early phase, there are some AWS Lambda and New Relic caveats to be aware of. Currently, New Relic’s integration with the Lambda Runtime Logs API will only send data pertinent to New Relic’s observability dashboards and can’t be configured to send all logs. To ingest more logs, users should install the New Relic log ingestion Lambda, which will send logs from CloudWatch. Users should also be aware that using the Logs API will not prevent logs from going to CloudWatch by default, and those who want to prevent their Lambdas from logging to CloudWatch will need to remove the IAM permission from their Lambdas.
New Relic's ongoing collaboration with AWS brings real insight into the functioning of your AWS Lambda-based applications. Our collaboration with AWS has continued to grow in 2020, from our implementation of the Extensions API, to advanced infrastructure monitoring using the CloudWatch API and adopting the OpenTelemetry standard.
Sign up for a free New Relic One account to start functioning faster today.
이 블로그에 표현된 견해는 저자의 견해이며 반드시 New Relic의 견해를 반영하는 것은 아닙니다. 저자가 제공하는 모든 솔루션은 환경에 따라 다르며 New Relic에서 제공하는 상용 솔루션이나 지원의 일부가 아닙니다. 이 블로그 게시물과 관련된 질문 및 지원이 필요한 경우 Explorers Hub(discuss.newrelic.com)에서만 참여하십시오. 이 블로그에는 타사 사이트의 콘텐츠에 대한 링크가 포함될 수 있습니다. 이러한 링크를 제공함으로써 New Relic은 해당 사이트에서 사용할 수 있는 정보, 보기 또는 제품을 채택, 보증, 승인 또는 보증하지 않습니다.


