Imagine it’s late Sunday evening and you’re sitting at your Red Bull-strewn desk. After days of troubleshooting your deployment, you’re elated because your team has just pushed a major update to your e-commerce website a day before the company’s big sale. But soon worry starts to creep in. What if your update broke a critical workflow and customers can’t make purchases? How can you know for sure every use case was covered by testing? Not every broken process registers as an error, so you might not learn about an issue until a customer complains. Here’s where synthetic monitoring comes in.
Synthetic monitors are vital to ensuring your website is working properly with minimal impact on customers. These monitors continually test business-critical processes and proactively alert you when they’re broken. If IT downtime costs a company thousands of dollars per minute, imagine the cost of having an e-commerce site that’s running, but on which no one can make a purchase because the checkout button is missing.
However, as useful as synthetic monitors are, they can be tedious to set up. That’s why the New Relic team invested a lot of effort to make the synthetic experience as easy to set up and deploy as possible.
What’s new with synthetic monitoring?
These updates to synthetic monitoring help you set up and deploy monitors quickly:
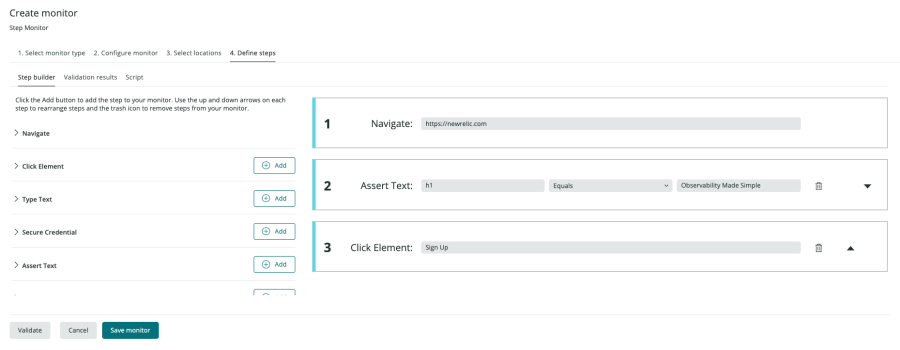
- New monitor type: step monitor. This monitor type allows you to set up a monitor without code, broadening the number of business users who can set up monitors.
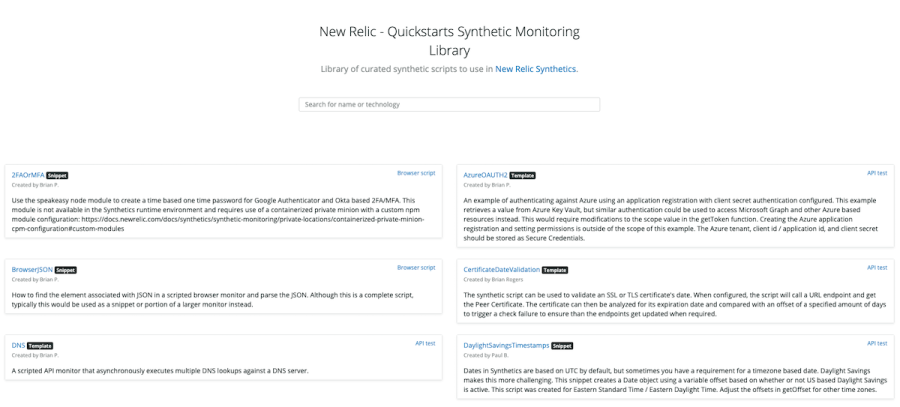
- Quickstarts Synthetic Monitoring library. This page includes pre-built scripts for synthetics so you don’t have to start from scratch.
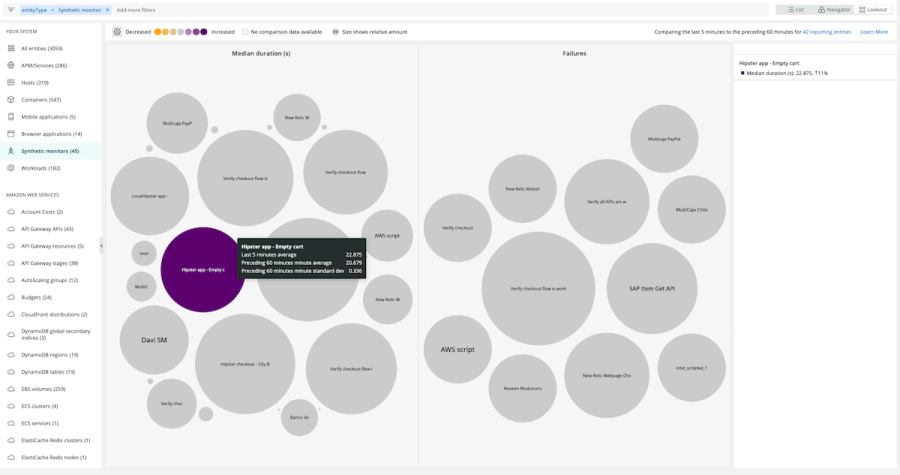
- Visualize monitors in Lookout. This enhancement to New Relic Lookout make it easy to visualize the state of your website in one place.
The next sections go into detail about these updates. If you are eager to set up your first step monitor, jump right to the "How to set up your first step monitor" section.
Create monitors easily with the step monitor
The step monitor provides a no-code way to set up synthetic monitors. You simply add “steps” and enter the actions you want the monitor to perform. You can verify that specific text or elements (like buttons and images) are on the page, verify functionality by clicking on elements, and even log in to a site by entering text.
Don’t start from scratch—use a template
Not sure where to start? Check out our Quickstarts Synthetic Monitoring library for commonly used monitors to get you started faster. This constantly expanding list is community-driven and includes scripts that help you authenticate against Azure, get a Google Lighthouse Audit report, and more.
Spot performance changes across monitors in Lookout
Synthetics are now integrated with Lookout to provide a quick view into how your websites are performing and whether there are any critical errors. See all of your synthetic monitors in a single view with highlights indicating which monitors are finding abnormal performance changes and where to focus your attention.
An improved way to create synthetic monitors
In addition to launching the new step monitor, we also updated the experience. If you’re still seeing the previous experience, you might need to select Show new view. The following example shows the previous experience for creating monitors, but you can select Show new view to see the new, streamlined view:
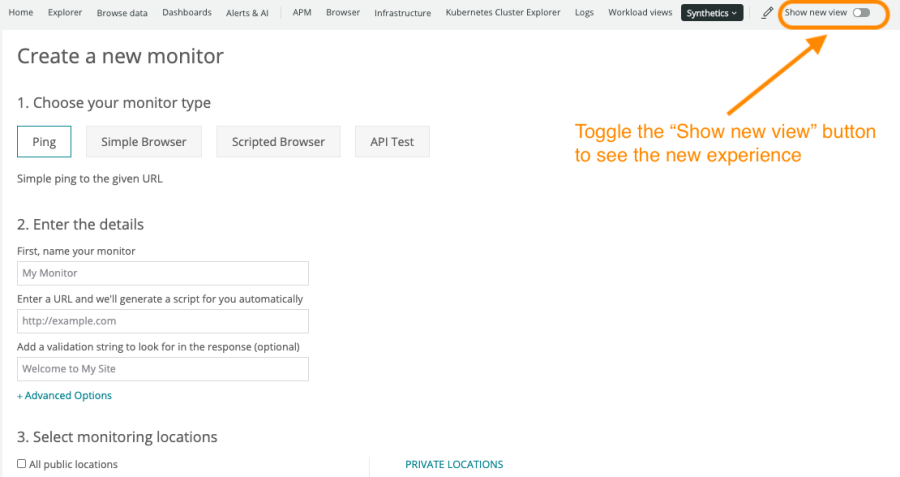
Note that you can only create step monitors in the new view, so make sure you have Show new view selected.
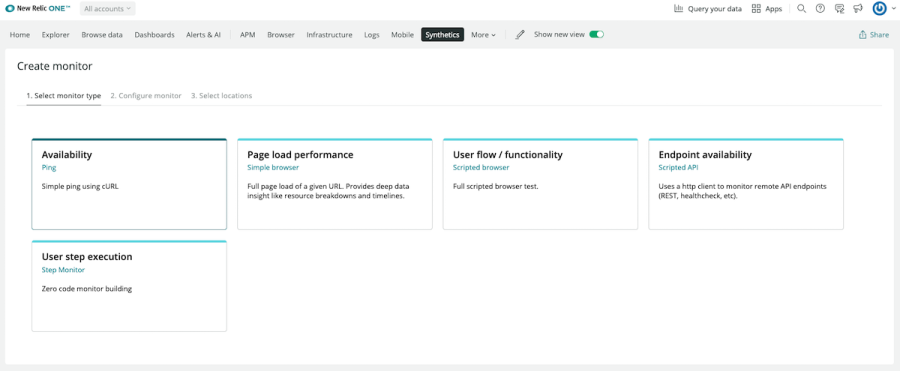
The new view separates the different monitor types into cards and guides you through the setup process, depending on the monitor you select:
How to set up your first step monitor
Follow this step-by-step guide to set up a step monitor for your website.
1. Select the Synthetics tab and click Create monitor in the top right corner:

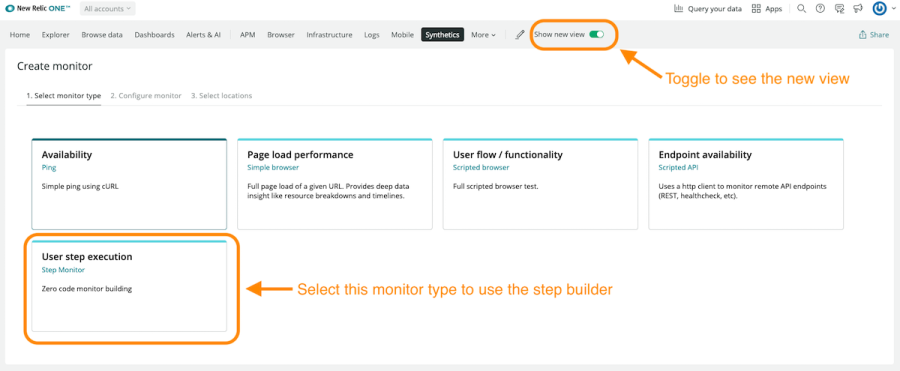
2. Make sure Show new view is selected. Then select the User step execution option (also called a step monitor):
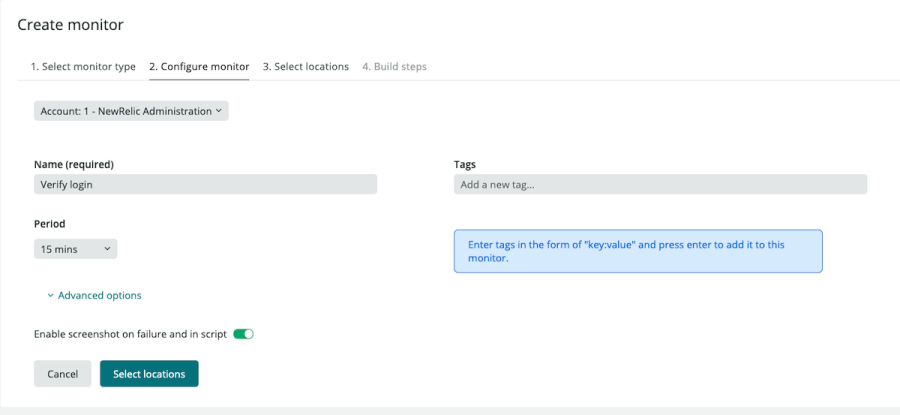
3. Configure the monitor.
Enter a descriptive name for your monitor, how often you want the monitor to check your site, and whether you want it to take a screenshot when an error is detected (under Advanced options):
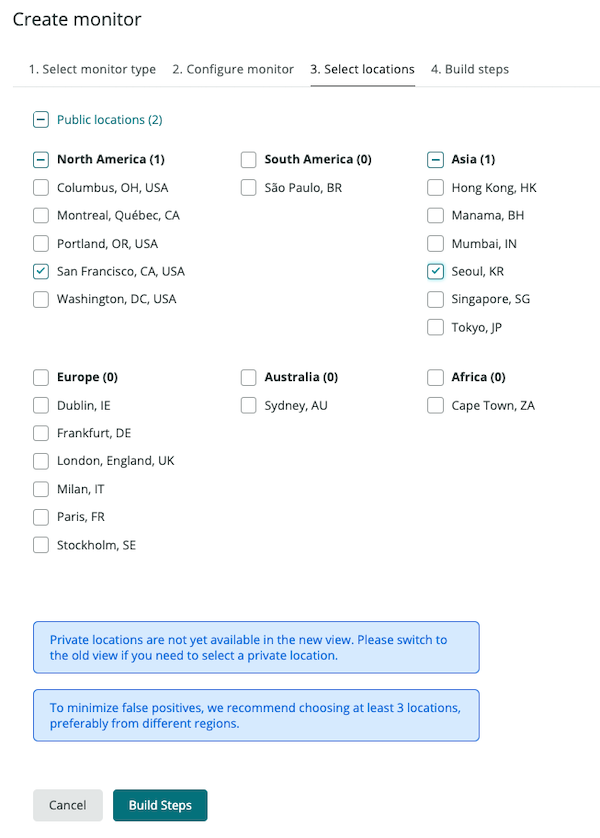
4. Select locations for the monitor.
Set up your monitor to test from one of New Relic’s worldwide locations. It monitors how your users from all over the world are able to access your page with high performance:
5. Enter the steps for your monitor.
Now the fun begins. Start by entering the URL for the site you want to monitor:
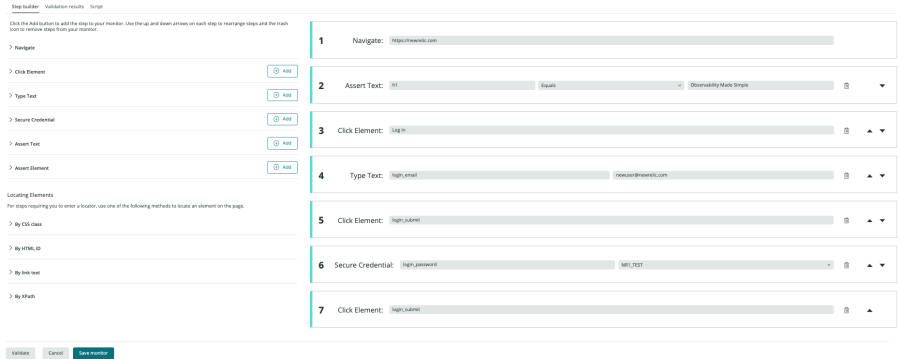
For each subsequent step, click one of the Add Step buttons at the bottom of the screen:
- Assert Text: Test that specific text appears or doesn’t appear on the screen.
- Assert Element: Test that a specific element (e.g., buttons, divs, images, etc.) are on the page or are visible.
- Click Element: Interact with elements on the page, like buttons.
- Type Text: Enter text on the page.
- Secure Credential: Use a password in a monitor without exposing it to everyone in New Relic.
To locate elements in the monitor, you have several options. You can locate by:
- CSS Class
Example:#stylized-button
The locator is“#stylized-button” - HTML ID
Example:<div id = “button”></div>
The locator is“button” - Link Text
Example:<a href="http://example.com>Link text</a>
The locator is is“Link text”and the text is also“Link text” - XPath
Example:<input placeholder=“search-query-field”>
The locator is“//input[@placeholder = 'search-query-field']”
6. Test your monitor.
You always want to test your monitor before deploying, so we’ve made it easy. Under Build steps, select Test and click Run Test.
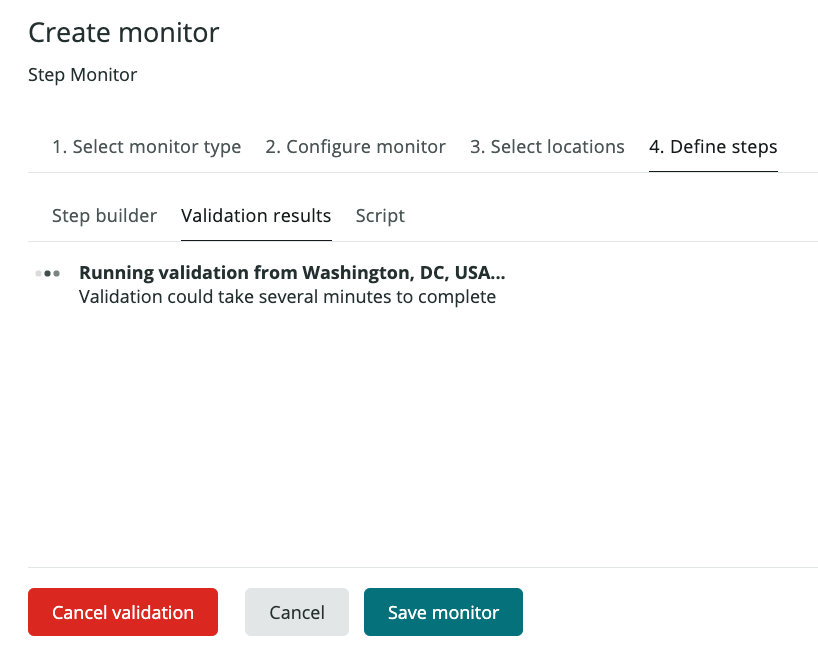
If there’s an error or an element isn’t found, the monitor automatically highlights the broken step and details about the error, so you can troubleshoot.
7. Sit back and watch.
After the monitor is saved, the New Relic One UI generates a Selenium IDE script so you can do direct script editing for more advanced tests. For example, you could edit the script directly to use a regex instead of simple matching for string tests.
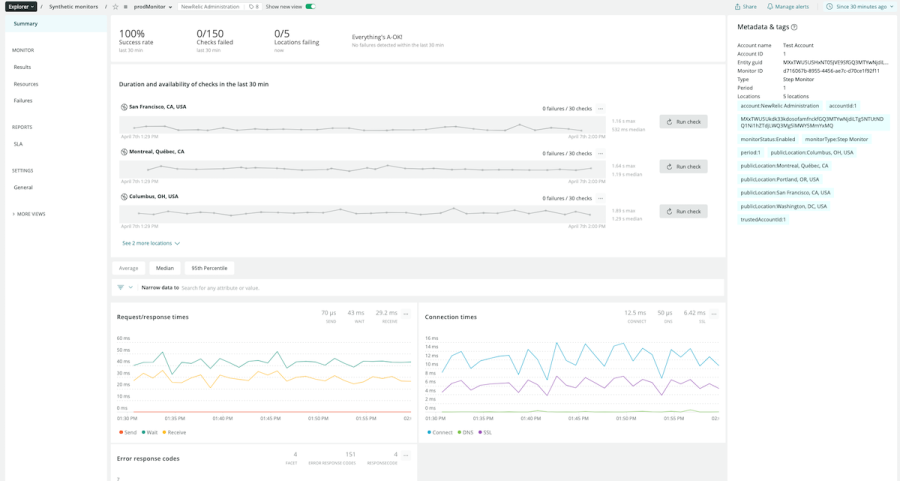
To view a summary of the performance of your user flow, simply select the monitor name. Then you can see request/response times, error response codes, duration, metadata, and tags:
To learn more and see a detailed walkthrough, watch the Nerdlog episode “Test Complex User Flows With No Code”:
다음 단계
There’s a lot more to learn about step monitors and New Relic Synthetic Monitoring. Read our documentation, request a demo or free trial today.
이 블로그에 표현된 견해는 저자의 견해이며 반드시 New Relic의 견해를 반영하는 것은 아닙니다. 저자가 제공하는 모든 솔루션은 환경에 따라 다르며 New Relic에서 제공하는 상용 솔루션이나 지원의 일부가 아닙니다. 이 블로그 게시물과 관련된 질문 및 지원이 필요한 경우 Explorers Hub(discuss.newrelic.com)에서만 참여하십시오. 이 블로그에는 타사 사이트의 콘텐츠에 대한 링크가 포함될 수 있습니다. 이러한 링크를 제공함으로써 New Relic은 해당 사이트에서 사용할 수 있는 정보, 보기 또는 제품을 채택, 보증, 승인 또는 보증하지 않습니다.


