This post is adapted from a series of best-practice guides that reflect the New Relic Community Team’s work helping thousands of customers get started using New Relic Alerts. Also check out our guides to getting started with New Relic APM, New Relic Infrastructure, New Relic Browser, New Relic Mobile, New Relic Synthetics, and New Relic Insights; and discover the New Relic Community Team’s latest Best Practice Guide offerings.
Alerting is an indispensable practice, keeping your teams in the know about potential performance issues before they even happen. You can’t possibly watch your site every second of every day, and with New Relic Alerts, you don’t have to; when a monitored application, host, or other entity triggers a pre-defined alert condition, Alerts notifies you automatically.
New Relic Alerts ensures that the right members of your team get the alerts they need as quickly as possible. And with features such as incident rollups and prioritized search terms, Alerts helps to minimize the risk that “alert fatigue” will lead to mistakes and miscommunication in your incident response process.

Every day, we hear from customers with questions about where and how to get the greatest value from New Relic Alerts. The following guide presents our most popular and useful answers: insider tips and best practices with special value for organizations getting started using New Relic Alerts in conjunction with other elements of the New Relic platform.
(If you’re completely new to New Relic, we suggest starting with this primer and series of short videos that offer a quick but thorough introduction to our family of products, the technology that powers them, and their place in modern software development.)
Tips to organize and optimize New Relic Alerts
Set up policies and conditions
Creating an effective alert policy can be challenging for users who aren’t familiar with New Relic Alerts terminology and its organizational approach. Fortunately, there’s a wealth of useful information on these topics to get you started.
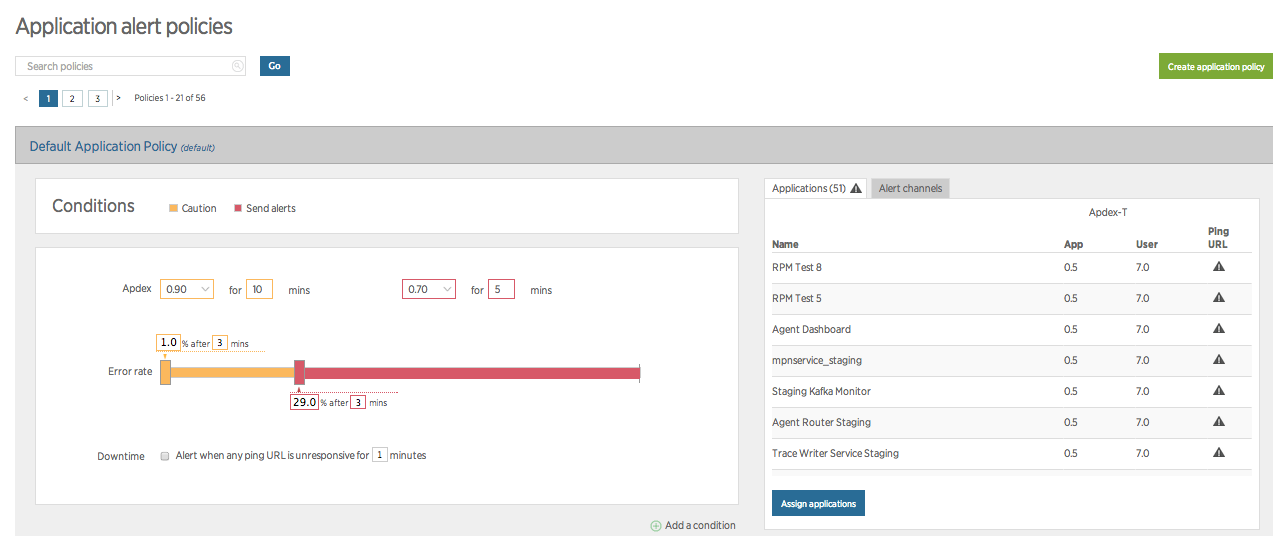
Configuring an alert involves three key parameters: developing the correct set of conditions (what you are alerting on), thresholds (the values that will trigger the alert), and notification channels (where the alerts information will be sent). An Alerts policy is a collection of conditions, all designed to target specific entities (apps, hosts, monitors, etc.). A violation is an occurrence of your conditions being triggered by your pre-set thresholds being breached.

Here’s where things can get tricky: While you can have multiple conditions per policy, your notifications apply on a policy-wide basis. When team members receive notifications on a policy, for example, you can’t “filter” alerts to notify some of these recipients but not others. What this means is that you’ll want to group your conditions into policies that are appropriate for every team member designated to receive notifications on that policy.
New Relic offers two very useful tutorials covering these topics: one focusing on alert policies and another on alert notification channels. We also suggest learning more about defining alert conditions, configuring alert policies, and working with notification channels in New Relic Alerts.
Choosing and using incident preference
Incident preference in Alerts is a policy-wide setting that specifies the frequency of alert notifications you will receive for each policy. By default, if there’s an open incident (i.e. an condition was triggered, opening a violation that requires attention) for a policy, then any new violation of any condition within that policy will roll up into that initial incident. What this means is that none of the additional violations will trigger a notification; your team will have to close the open incident, and a new violation will have to occur, before Alerts sends any other notifications for that policy.
This default behavior exists for a good reason: In some situations, a policy may trigger large numbers of redundant or irrelevant notifications. These can distract or even overwhelm a team—one way that “alert fatigue” can erode your ability to deal with legitimate performance issues. But it may also result in a team missing important or urgent notifications.
Incident preference solves this dilemma; it allows you to create new incidents, on an opt-in basis, using the default (policy-based) frequency or to create incidents based on violations involving a specific condition or a specific combination of a condition and a particular entity (apps, hosts, monitors, etc.). Each of these options, in turn, will generate more notifications, allowing you to decide where to balance awareness of new issues against the need to keep notifications as a manageable level.
A best-practice approach involves setting up an account-wide, standard practice for incident preference in Alerts, helping to ensure that you get the notifications you need, when you need them. Alert Incident Preferences are the Key to Consistent Alert Notifications (a New Relic Level Up post) walks you through a detailed discussion of how to use incident preference, how to set alert policies, and related topics.
Set up a notification channel
As mentioned above, notification channels dictate where your alert notifications are sent. You can configure a notification channel to send automatically to a specific user on an account, using a particular email address, or by choosing one of several pre-configured integrations with popular messaging services. And if those don’t get the job done, you can also leverage webhooks in Alerts to send notifications just about anywhere you can imagine.

Remember that notification channels are set against policies; the best approach is to identify conditions that require attention from the same individual or teams, and to group those conditions into a single policy.
If you want to learn more about these topics (a very good idea!), begin with an overview of how to create, use, and manage notification channels in New Relic Alerts. We also recommend reviewing the New Relic tutorial covering the Alerting Incident Life Cycle, as well as a New Relic Level Up post that explains everything you need to know about using webhooks to create custom notifications.
Understanding what you see in New Relic Alerts
Learn the language of alerting
When you work with New Relic Alerts, you’ll encounter a number of new and unfamiliar terms. Most of these are fairly intuitive, but it’s very useful to keep the New Relic Alerts Glossary close at hand until you build some experience using them.
Explore an incident
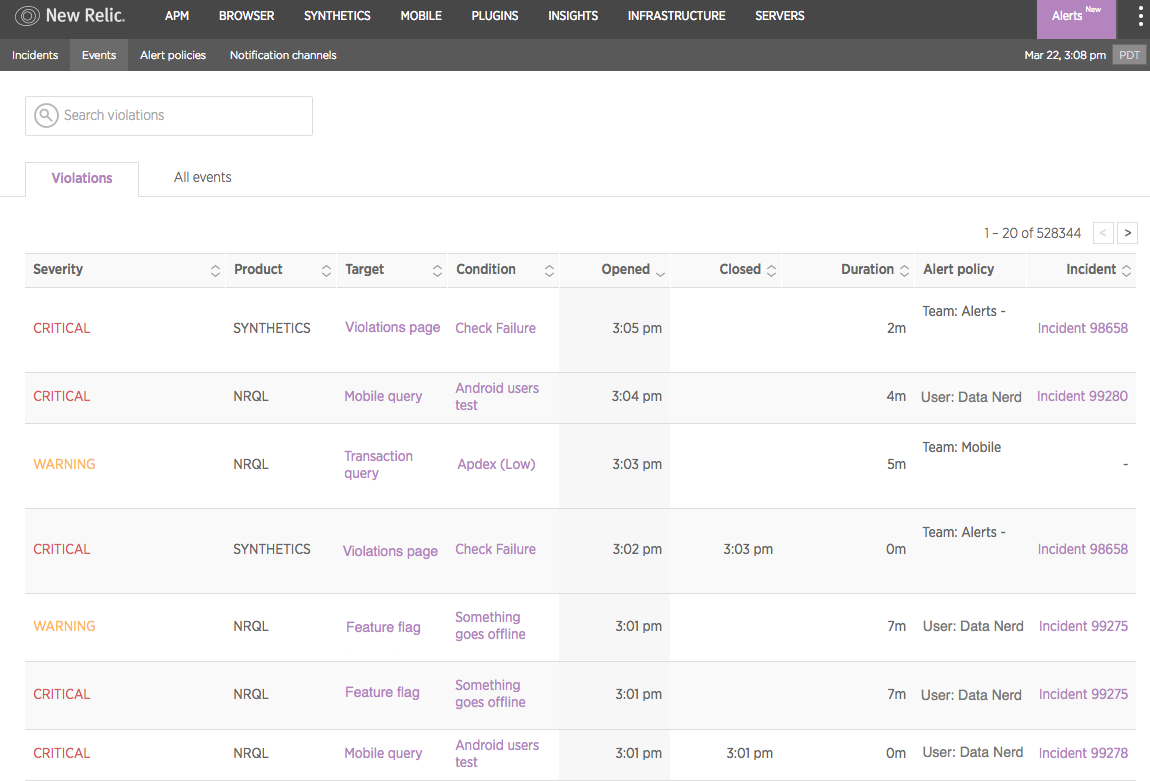
New Relic Alerts offers an incident view feature that groups together all of the violations that have occurred in a policy and presents them as a timeline. Exploring this timeline gives you a better understanding of what triggered an event; where and how subsequent issues appeared, and how the relationship between all of these issues might inform the resolution process.
New Relic Alerts also allows team members to acknowledge incidents—indicating that they are working on identifying and addressing any underlying issues. Typically, when an incident is resolved, Alerts automatically closes related violations; for example, Alerts closes violations when the opposite of the threshold criteria that triggered the violation occurs. It is also possible, however, to close violations and resolve alert conditions manually when necessary.
New Relic University offers a pre-New Relic Alerts, best practices, alerting webinar with a deep dive into the Alerting incident lifecycle. You may also want to review support documents that cover how to acknowledge Alerts incidents and how to close violations manually.
Taking action on your alerts
Incident context
There are countless reasons why an application might suffer from longer response times—the culprit, for example, could be anything from slow database calls to slow external services. Normally, working backwards to track down the starting point for an incident can be a grueling and time-consuming process—with no promise that you’ll have the data required to get a clear answer.
The New Relic Alerts incident context feature gives teams a fast, reliable, and powerful alternative approach. Incident context analyzes an application or other entity at the time that its performance triggered an alerting threshold. If Alerts detects anomalous behavior that correlates to an alert violation, it will report that correlation in the incidents UI and, if appropriate, include a link to the relevant New Relic product chart—putting data at a team’s fingertips that might have taken many hours of work to track down before.
Send Alerts data to Insights
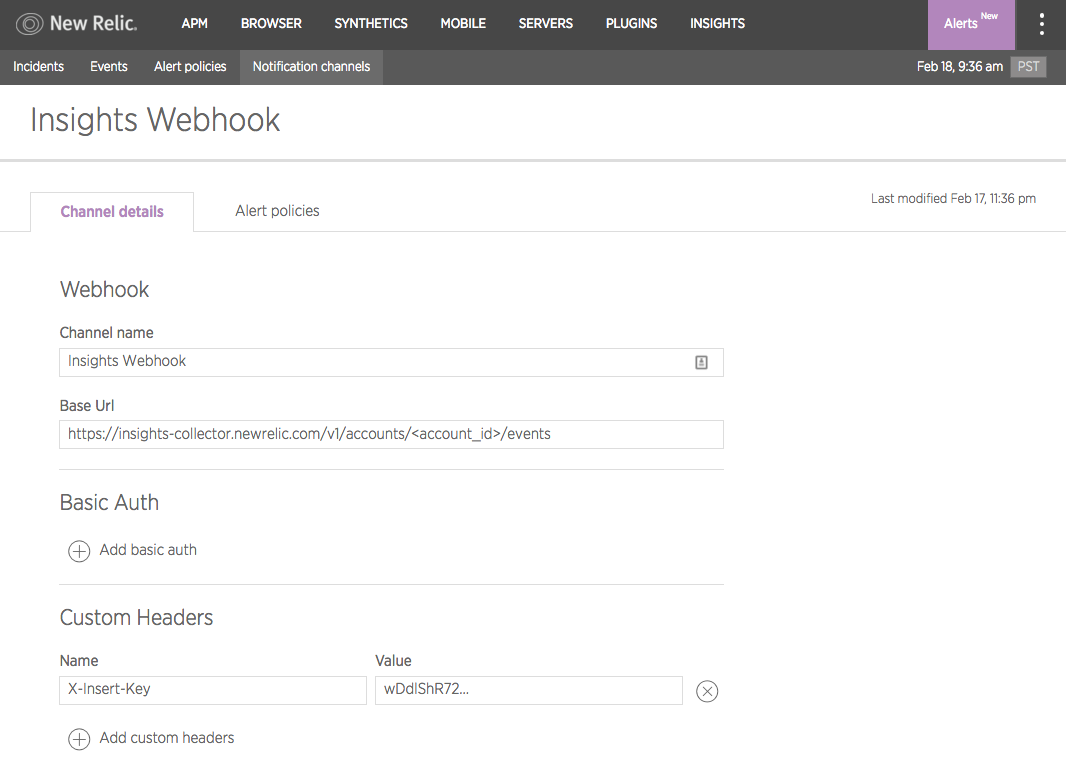
By default, Alerts events are not available in Insights. By using the flexible webhook notification channel in Alerts, however, it is possible to send alert notifications to the Insights insert API to track these alerts as custom events.
Sending Alerts data to Insights opens a wide range of additional possibilities for analyzing this data and extracting useful information from it. A team could, for example, create dashboards that answer questions such as, “Which policies are most frequently violated?” or “What are the five most recent Alerts violations?”’
Learn more about sending Alerts data to New Relic Insights using webhooks and the Insights insert API.
Set up a baseline alert
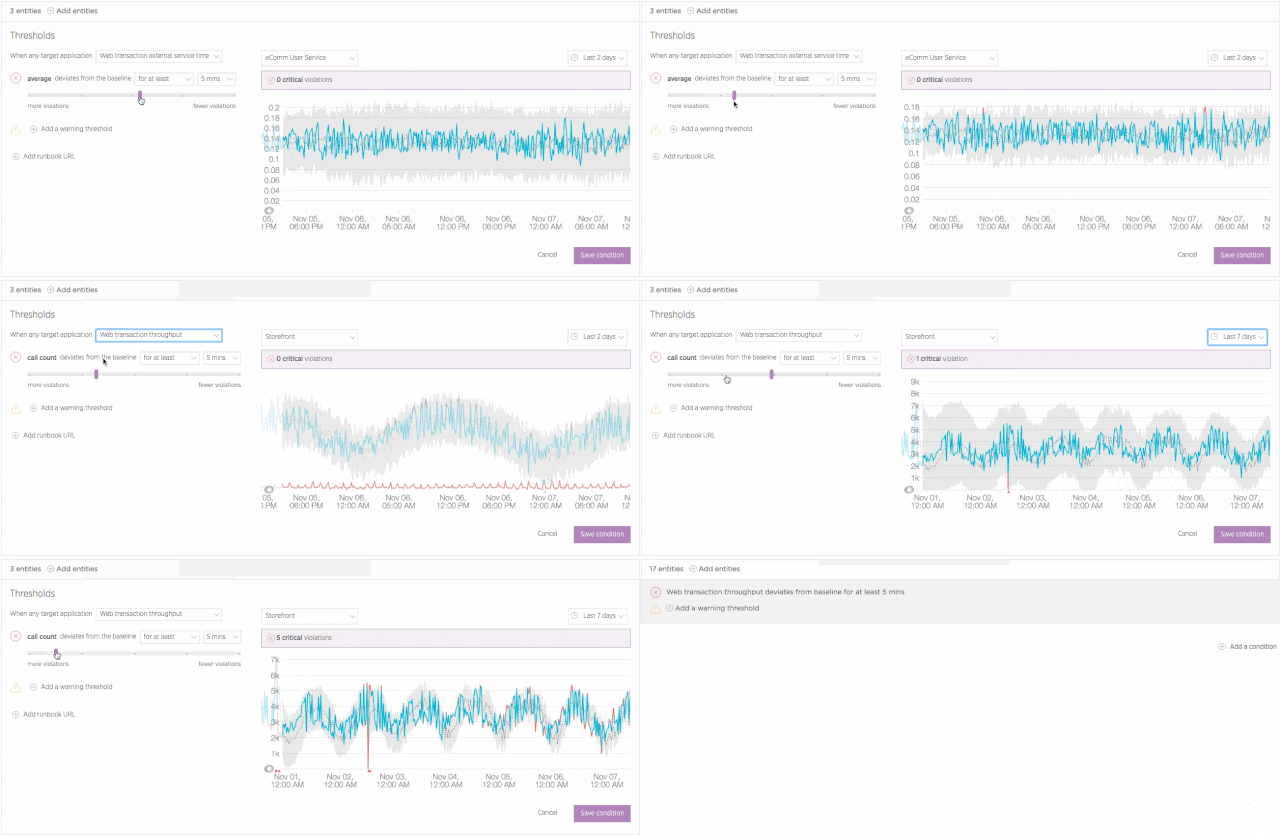
It isn’t always useful or even advisable to apply “one size fits all” thinking to application performance. For example, a business application might see higher throughput during business hours, which means there’s a higher potential for resource exhaustion than there might be over weekends. Given these variations, it’s not always a viable option to set a single alerting threshold for your apps on a 24/7 basis.
Baseline alerts address this challenge by learning to recognize patterns in your application performance data. Initially, this process requires about two weeks of performance data. However, over long time periods, baseline alerts continue to analyze performance and to establish baselines that make sense for a given time span. This allows you to set conditions that trigger when any of an application’s standard alerting metrics (error rate, response time, etc.) deviate from a baseline that is appropriate for that time—and not simply based on a single, and sometimes inappropriate, threshold.
Learn more about configuring and using baseline conditions in New Relic Alerts.
Ready to learn more?
Looking for more New Relic Alerts best practices and tips? Check out the Alerts Level Up category here.
Also, remember that when you're ready to show off your new skills, be sure to take the New Relic Alerts Best Practices Quiz and earn your proficiency badge!
이 블로그에 표현된 견해는 저자의 견해이며 반드시 New Relic의 견해를 반영하는 것은 아닙니다. 저자가 제공하는 모든 솔루션은 환경에 따라 다르며 New Relic에서 제공하는 상용 솔루션이나 지원의 일부가 아닙니다. 이 블로그 게시물과 관련된 질문 및 지원이 필요한 경우 Explorers Hub(discuss.newrelic.com)에서만 참여하십시오. 이 블로그에는 타사 사이트의 콘텐츠에 대한 링크가 포함될 수 있습니다. 이러한 링크를 제공함으로써 New Relic은 해당 사이트에서 사용할 수 있는 정보, 보기 또는 제품을 채택, 보증, 승인 또는 보증하지 않습니다.


