Quickstart
Integration Features
Dashboards
Alerts
Documentation
dashboards
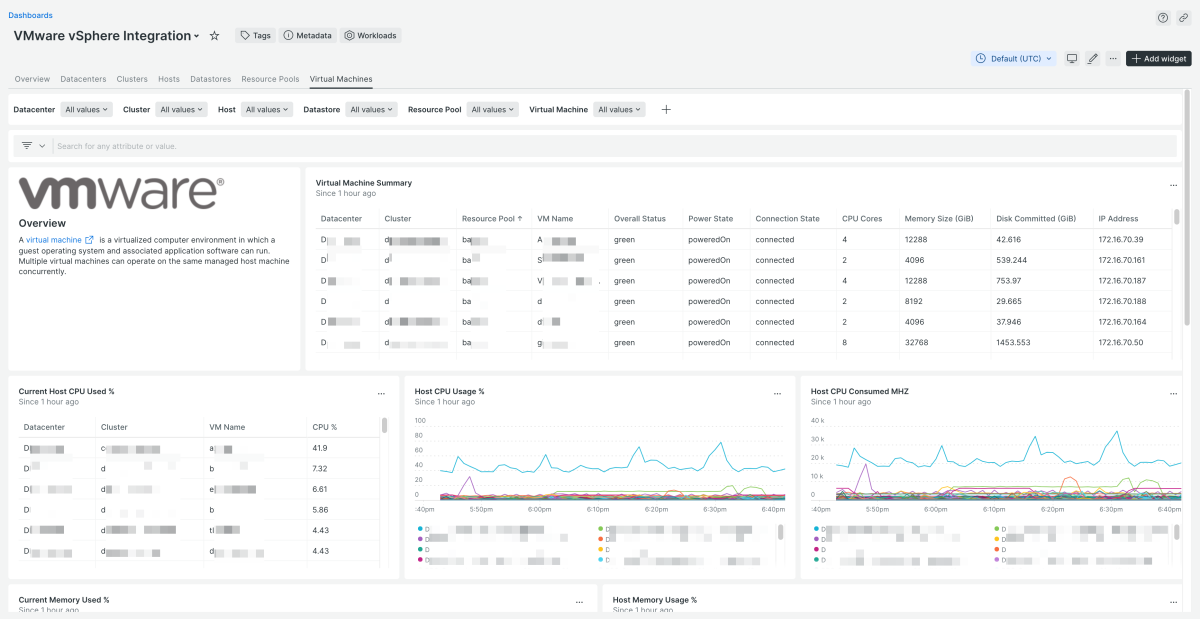
VMware vSphere quickstart contains 1 dashboard. These interactive visualizations let you easily explore your data, understand context, and resolve problems faster.
Show MoreShow Less
VMware vSphere Integration
See all
alerts
VMware vSphere observability quickstart contains 13 alerts. These alerts detect changes in key performance metrics. Integrate these alerts with your favorite tools (like Slack, PagerDuty, etc.) and New Relic will let you know when something needs your attention.
Show MoreShow Less
1. vSphere Datastore is not accessible
This alert fires when a vSphere Datastore is not accessible for longer than 5 minutes, indicating a loss of connectivity.
2. vSphere Resource Pool overallStatus = 'red'
This alert fires when a vSphere Resource Pool has an overall status = 'red' for longer than 5 minutes.
3. vSphere Datastore overallStatus = 'red'
This alert fires when a vSphere Datastore has an overall status = 'red' for longer than 5 minutes.
4. vSphere Datacenter overallStatus = 'red'
This alert fires when a vSphere Datacenter has an overall status = 'red' for longer than 5 minutes.
5. vSphere Host overallStatus = 'red'
This alert fires when a vSphere Host has an overall status = 'red' for longer than 5 minutes.
6. vSphere Datastore high Capacity Utilization
This alert fires when a vSphere Datastore has capacity utilization % > 90 for longer than 10 minutes.
7. vSphere Host high Memory Utilization
This alert fires when a vSphere Host has memory utilization % > 90 for longer than 5 minutes.
8. vSphere Resource Pool high CPU Utilization
This alert fires when a vSphere Resource Pool has a CPU utilization % > 90 for longer than 5 minutes.
9. vSphere Host high CPU Utilization
This alert fires when a vSphere Host has a CPU utilization % > 90 for longer than 5 minutes.
10. vSphere Host connection lost
This alert fires when a vSphere Host is not responding to heartbeats for longer than 5 minutes.
11. vSphere Virtual Machine overallStatus = 'red'
This alert fires when a vSphere Virtual Machine has an overall status = 'red' for longer than 5 minutes.
12. vSphere Cluster overallStatus = 'red'
This alert fires when a vSphere Cluster has an overall status = 'red' for longer than 5 minutes.
13. vSphere Resource Pool high Memory Utilization
This alert fires when a vSphere Resource Pool has memory utilization % > 90 for longer than 5 minutes.
documentation
VMware vSphere observability quickstart contains 1 documentation reference. This is how you'll get your data into New Relic.
Show MoreShow Less

