New Relic Now Start training on Intelligent Observability February 25th.
Save your seat.
Pour le moment, cette page n'est disponible qu'en anglais.
 / 
Pinecone (Prometheus)

Pinecone (Prometheus)

Implement monitoring and integrate your Pinecone application with New Relic for performance analysis and insights.

What's included?

dashboards
1
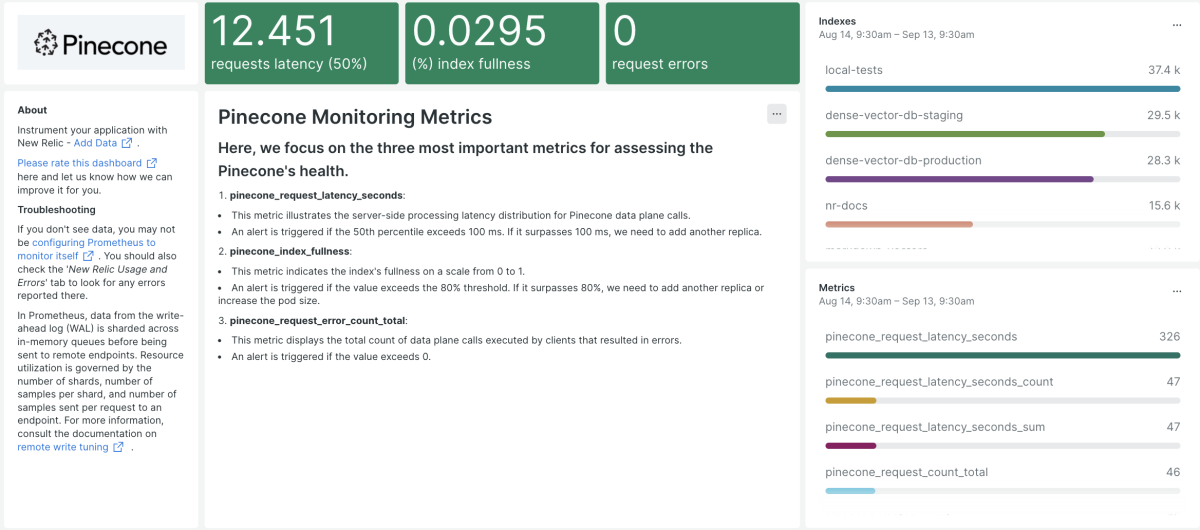
Pinecone (Prometheus) quickstart contains 1 dashboard. These interactive visualizations let you easily explore your data, understand context, and resolve problems faster.
alerts
3
Pinecone (Prometheus) observability quickstart contains 3 alerts. These alerts detect changes in key performance metrics. Integrate these alerts with your favorite tools (like Slack, PagerDuty, etc.) and New Relic will let you know when something needs your attention.
Pinecone Request Latency
- This metric illustrates the server-side processing latency distribution for
Pinecone data plane calls
- An alert is triggered if the 50th percentile exceeds 100 ms
- Resolution: If it surpasses 100 ms, we need to add another replica
Pinecone Request Errors
- This metric displays the total count of data plane calls executed by clients that resulted in errors
- An alert is triggered if the value exceeds 0
Pinecone Index Fullness
- This metric indicates the index's fullness on a scale from 0 to 1
- An alert is triggered if the value exceeds the 80% threshold
- Resolution: If it surpasses 80%, we need to add another replica or increase the pod size

Why monitor Pinecone vector database?

Pinecone monitoring is essential for ensuring the smooth operation of your system and the delivery of accurate data insights. By monitoring Pinecone, you will be able to:

Tune performance:

Optimize Pinecone with detailed insights, address bottlenecks, reduce latency.

Scale as required:

Identify any potential scalability issues early on and take steps to address them.

Security:

Monitor unusual activities or security breaches, helping you identify and mitigate security threats promptly.

Proactive Issue Detection:

Spot performance degradation or errors before they impact your application

Comprehensive monitoring quickstart for Pinecone

The Pinecone quickstart continuously monitors crucial performance indicators and metrics in real time to maintain peak system performance, detect and address potential issues before they escalate.

What’s included in the Pinecone quickstart?

New Relic Pinecone monitoring quickstart offers a range of out-of-the-box reports, including:

  • Real-time insights into the performance of your Pinecone deployment
  • Detection of performance bottlenecks and enhance Pinecone configuration to optimize performance
  • Efficient troubleshooting of your Pinecone deployment with New Relic suite of tools
  • Dashboard that shows Pinecone vector count, request count, request error count, request latency, index fullness, and more

How to use this quickstart

  • Sign Up for a free New Relic account or Log In to your existing account.
  • Click the install button.
  • Install the quickstart to get started or improve how you monitor your environment. They're filled with pre-built resources like dashboards, instrumentation, and alerts.
Authors
New Relic
Support
BUILT BY NEW RELIC
Need help? Visit our Support Center or check out our community forum, the Explorers Hub.