Quickstart
Integration Features
Dashboards
Alerts
Documentation
dashboards
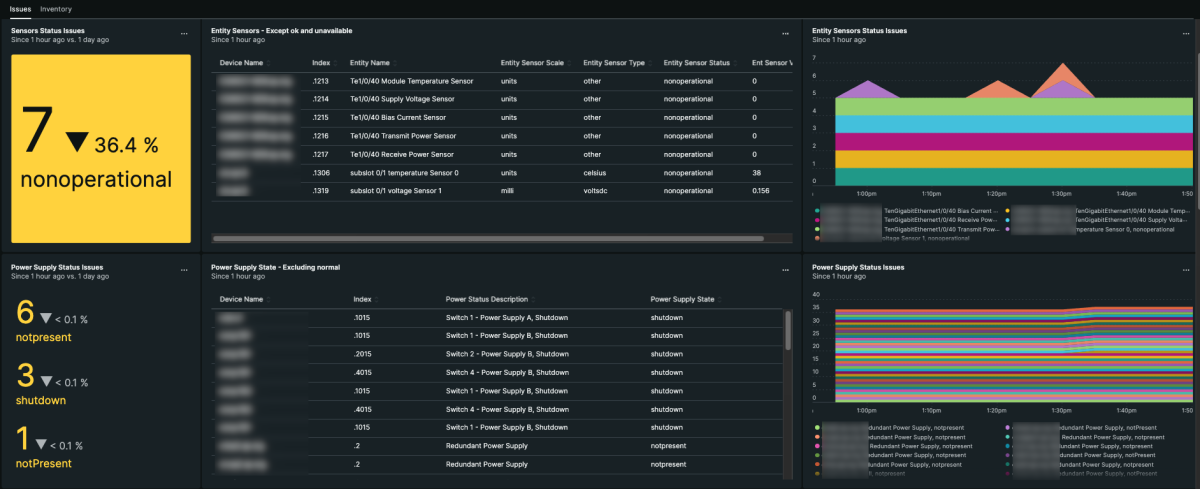
Cisco Hardware Sensor Dashboard quickstart contains 1 dashboard. These interactive visualizations let you easily explore your data, understand context, and resolve problems faster.
Show MoreShow Less
Cisco Hardware Status
See all
alerts
Cisco Hardware Sensor Dashboard observability quickstart contains 5 alerts. These alerts detect changes in key performance metrics. Integrate these alerts with your favorite tools (like Slack, PagerDuty, etc.) and New Relic will let you know when something needs your attention.
Show MoreShow Less
1. Cisco Temperature Status
This alert will trigger when a Cisco temperature sesnor status is not "normal" for 300 seconds. This typically indicates that there is a physical problem that requires investigation or replacement.
2. Cisco Fan Tray Status
This alert will trigger when a Cisco fan tray is not "ok" for 300 seconds. This typically indicates that there is a physical problem that requires investigation or replacement.
3. Cisco Fan Status
This alert will trigger when a Cisco fan is not "normal" for 300 seconds. This typically indicates that there is a physical problem that requires investigation or replacement.
4. Cisco Module Status
This alert will trigger when a Cisco field replaceable module is not "ok" for 300 seconds. This typically indicates that there is a physical problem that requires investigation or replacement.
5. Cisco Power Supply Status
This alert will trigger when a Cisco power supply is either "critical" or "shutdown" for 300 seconds. This typically indicates that there is a physical problem that requires investigation or replacement.
documentation
Cisco Hardware Sensor Dashboard observability quickstart contains 1 documentation reference. This is how you'll get your data into New Relic.
Show MoreShow Less

