Pour le moment, cette page n'est disponible qu'en anglais.
 / 
Azure Spring Apps

Azure Spring Apps

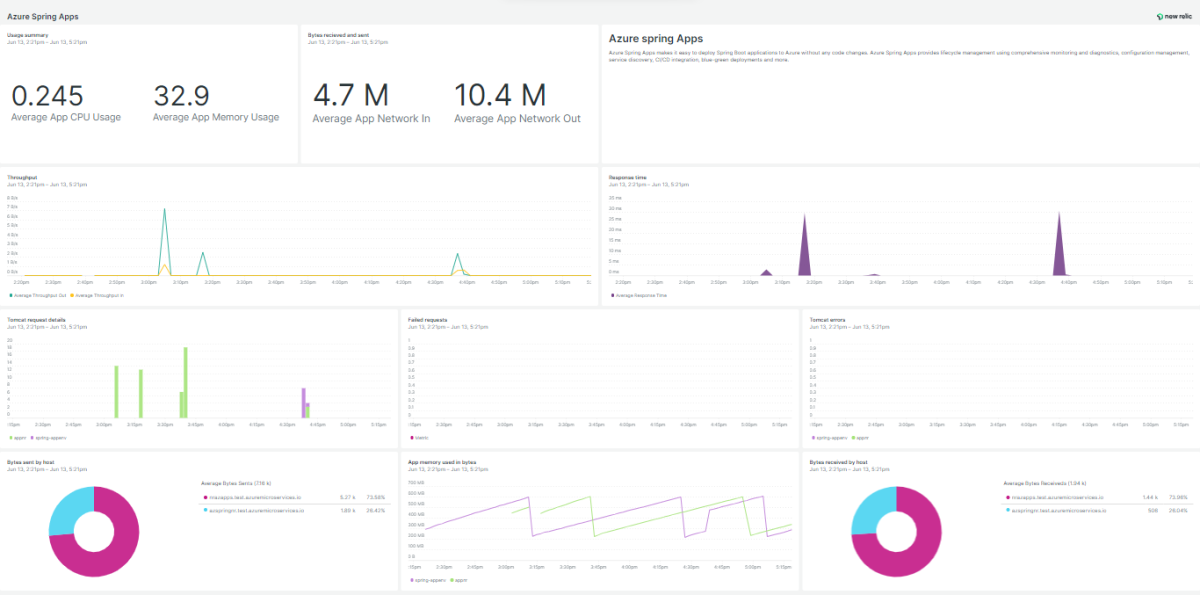
Monitoring Azure Spring Apps is critical to track the performance through key metrics. Download New Relic Azure Spring Apps monitoring quickstart to get a pre-built dashboard tailored to monitor your Azure Spring Apps service.

What's included?

dashboards
1
Azure Spring Apps quickstart contains 1 dashboard. These interactive visualizations let you easily explore your data, understand context, and resolve problems faster.
documentation
1
Azure Spring Apps observability quickstart contains 1 documentation reference. This is how you'll get your data into New Relic.
alerts
0
This quickstart doesn't include any alerts. Do you think it should?
You can edit this quickstart to add helpful components. View the repository and open a pull request.
View repo View repo

What is Azure Spring Apps?

Spring Cloud Azure is an open source project that helps make it easier to use Azure services in Spring applications.

New Relic Azure Spring Apps quickstart features

A standard dashboard that tracks key indicators like memory usage, CPU usage, global request total count and global request average time. It runs custom queries and visualizes the data immediately.

Why monitor Azure Spring Apps with New Relic?

New Relic Azure Spring Apps monitoring quickstart empowers you to track the performance of Azure Spring Apps via different metrics including memory usage, CPU usage, global request total count and global request average time.

Our integration features a standard dashboard that provides interactive visualizations to explore your data, understand context, and get valuable insights.

Start ingesting your Azure data today and get immediate access to our visualization dashboards so you can optimize your Azure service.

How to use this quickstart

  • Sign Up for a free New Relic account or Log In to your existing account.
  • Click the install button.
  • Install the quickstart to get started or improve how you monitor your environment. They're filled with pre-built resources like dashboards, instrumentation, and alerts.