Quickstart
What is Azure Application Insights?
Azure Application Insights is a service that monitors the performance of live web applications and detects anomalies. It is an extension of Azure Monitor and supports multiple platforms, such as .NET, Java, Python, and Node.js. It helps developers to understand how their applications are used and user interaction.
New Relic Azure Application Insights quickstart features
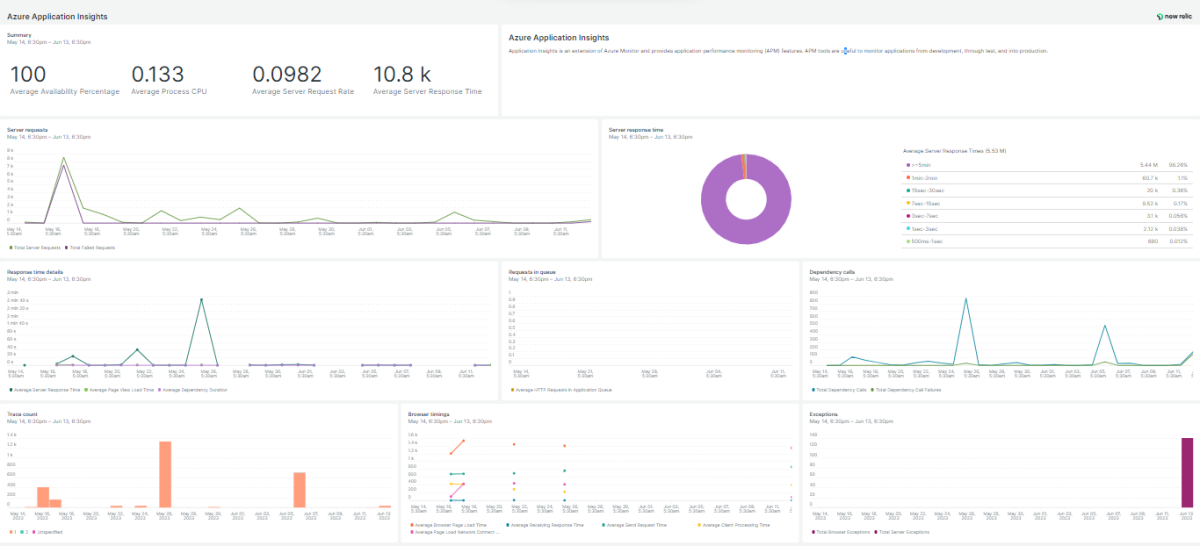
A standard dashboard that tracks key indicators like receiving response time, availability, dependency call failures and browser exceptions. It runs custom queries and visualizes the data immediately.
Why monitor Azure Application Insights with New Relic?
New Relic Azure Application Insights monitoring quickstart empowers you to track the performance of Azure Application Insights via different metrics including receiving response time, availability, dependency call failures and browser exceptions.
Our integration features a standard dashboard that provides interactive visualizations to explore your data, understand context and get valuable insights.
Start ingesting your Azure data today and get immediate access to our visualization dashboards so you can optimize your Azure service.
Need help? Visit our Support Center or check out our community forum, the Explorers Hub.


