Quickstart
What is TypeScript
TypeScript is an open source programming language built by Microsoft. It is a strict syntactical superset of JavaScript (i.e. JavaScript plus additional features). The language is primarily designed to empower developers to build large apps and transpiles to JavaScript.
Common uses of TypeScript
Oftentimes, developers using JavaScript complain about the absence of strong static characters, TypeScript perfectly addressed this challenge. Among many other things, developers can leverage TypeScript for the following:
- Build large-scale applications and transform their source code into JavaScript.
- Use IntelliSense which actively provides hints as code is added.
- Specify the types of data passed within the code, and report errors if types don't match.
What’s included in this quickstart?
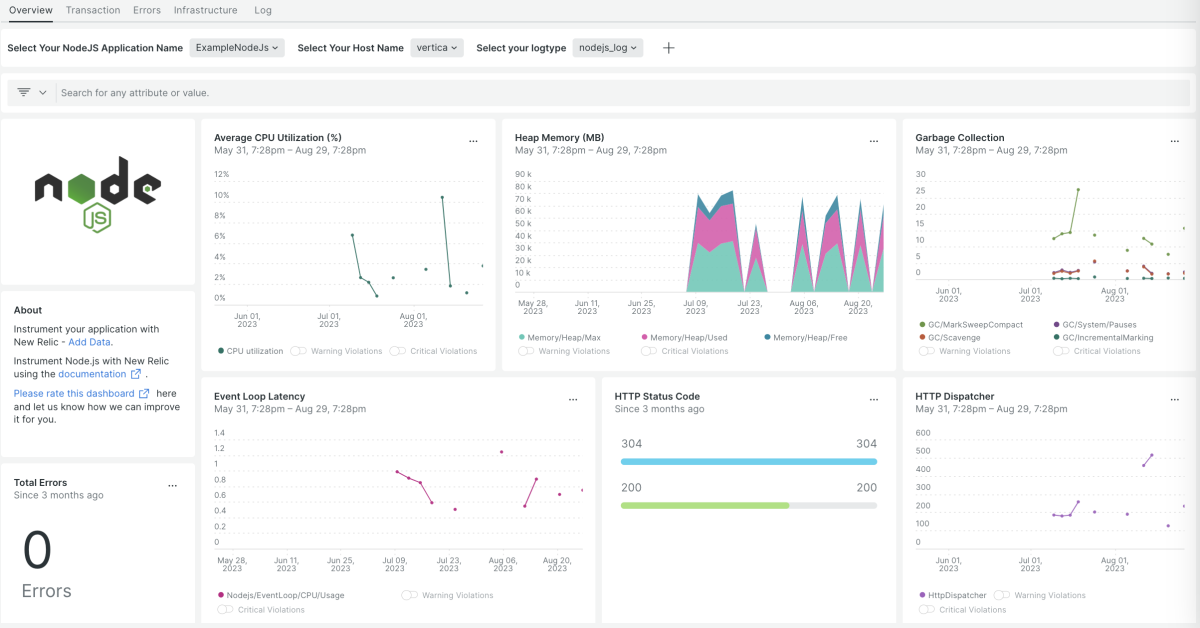
Montoring TypeScript is critical to help you access logs and identify errors in your application. With New Relic monitoring quickstart, you will get a scalable monitoring package that empowers you to identify performance issues before they happen. By monitoring TypeScript, you will achieve a seamless production flow while maintaining low latency with fast throughput.
Get these TypeScript monitoring features out of the box with our quickstart:
- Understand the health of your with: throughput and error rate data, logs, web transaction time, Apdex score, and more apdex score and more).
- Correlate TypeScript application metrics with your server’s primary health metrics, like CPU usage, memory, network usage, and disk space.
- Create high-value baseline alerts that proactively inform developers about the status of their apps.
Need help? Visit our Support Center or check out our community forum, the Explorers Hub.

