Nonprofit organizations, like The Water Project, are often in a challenging position when it comes to managing their tech stack. Users are used to the quality and performance they see on commercial enterprise apps that can grow their engineering teams easily. For nonprofits, resources from donations must be channeled into the projects that people are paying for, so we need to keep our dev teams small. Having an observability platform lets us operate at a much higher capacity than the size of our team would suggest: it’s like having multiple developers looking over our shoulders and pointing us to the next best tweak.
At The Water Project, we use digital solutions and in-field apps so that our teams can collaborate with local communities to ensure access to water and proper sanitation. We use our tech to collate project data, oversee management timelines, report on project spending, and share progress with funders. From an engineering and implementation point of view, we track water quality data and establish systems that provide long-term monitoring through smart devices and the Internet of Things.
The ability to monitor what is happening within our tech infrastructure is a fundamental part of our operations to ensure data flows through various vendors and into our bespoke apps. But how do we do that with a small engineering team with few resources? We focus on two key observability goals to help keep costs down: bug fixing and performance.
Performance monitoring: Global availability for users and donors
Performance is one area that nonprofits with limited resources often overlook. All of the work we do to tell the story of need and the opportunity for real impact can be lost when a donate page stalls on load. Even that first curious click to our homepage can be thwarted by an extra 200 millisecond load time. For potential donors and funding bodies visiting us for the first time, pauses in page loads provide opportunities for doubt or distraction to creep in.
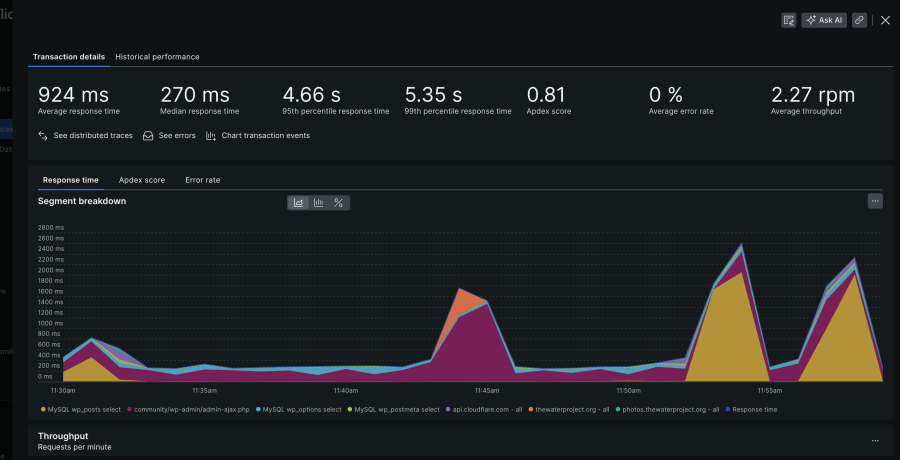
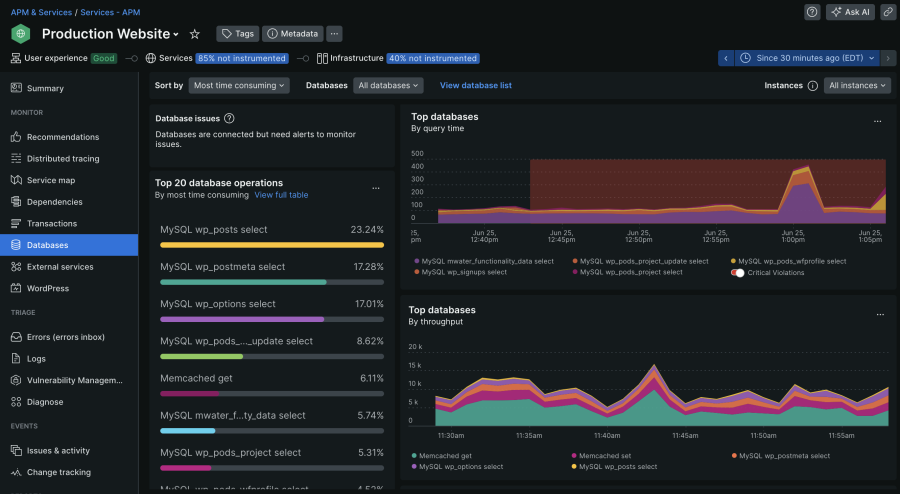
We need our site and services to be available, especially when donors are prepared to give. Using dashboards to keep real-world workflows in check means much less downtime as we can mitigate failing services as they happen often before a potential new supporter even sees the issue arise for them. Getting performance data through the application performance monitoring and services dashboards has been an excellent resource for us during performance tuning. This information provides actionable insights and has allowed us to add more memory to our servers, add a DB cluster, and help configure server-based and CDN caches.

For performance analysis, here are a couple of screenshots that give insight as to what to do next, JUST from a DB perspective.

We recently moved our tech services provider from Armor to DigitalOcean. When we were moving everything over, part of that whole exercise was seeing how the new servers performed versus how the Armor servers performed. New Relic helped us optimize our servers. Like with the donor load pages, milliseconds of response time add up. After the server move, we noticed that response time was slowing significantly. We were able to test optimization approaches by recompiling PHP in various ways and testing to see which configuration performed fastest. Now we can quantifiably understand which version of PHP is the right one for our stack, drawing on our infrastructure data and the New Relic testing.
Bug fixing: Getting to (errors) inbox zero
We need tools to support our top three priorities: highlight issues as they arise, help us dig into root causes, and help our small dev team concentrate on our project work. New Relic allows us to manage how much time is required to afford a level of comfort in each priority and has become a force multiplier for us.

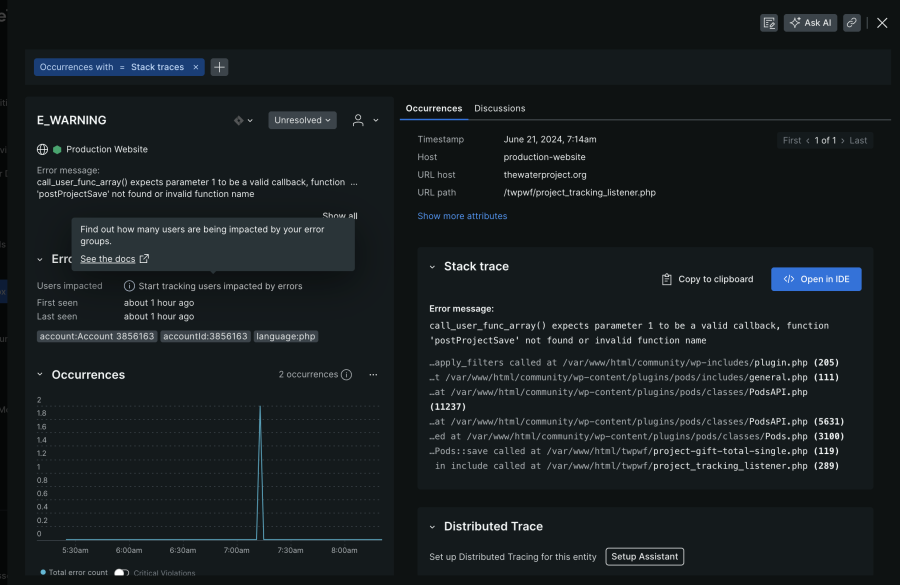
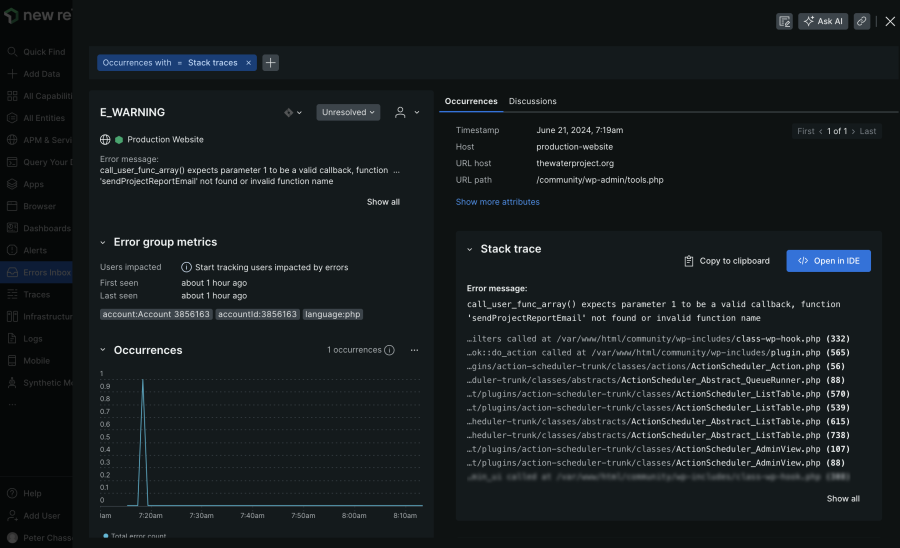
Here's an error that was found the other day and resolved in about 5 minutes. This was a PHP scoping error. Typical error that pops up with loosely enforced languages like PHP.

New Relic errors inbox lets us dig into issues currently facing our users and centralizes all of it. Because of the volume of our donations and other transactions—not necessarily financial transactions, but calls to our tech stack—there are a lot of times when we’re prone to bugs. With errors inbox, we can localize dates and quickly see each time the error has occurred. This is a helpful clue: when bug requests are submitted, it can be unclear whether it is a user error, a glitch in their ability to access our app or servers, or something more systemic. In system support, seeing multiple occurrences saves us time as it elevates the importance of solving the bug rather than being confused by whether it is a one-off situation.
New Relic’s logs interface helps teams quickly review where things have gone wrong. It has eliminated the need to access and scroll through logs via the console, which saves a lot of time. Our engineers also remain “in context” when digging into what is happening. With all of the additional data that New Relic surfaces, it becomes more intuitive to debug. Being able to look at that detailed technical information from a high level and being able to consume it quickly, and interpret it with reasonable accuracy, speeds up the time to resolution.
Recently, we deployed an application to replace an old arduous process. In the old process, integration teams in Africa uploaded a bunch of photos to Dropbox, then our US team had to download and reformat, resize, and rename all images. The application we built allows that process to be automated. Now, the integration teams have an interface where they can upload everything at once. The US teams have a portal where they can approve everything. The software does all the manual image processing and optimizations. When we deployed the application, we went through a bunch of tests in New Relic to see how it was going to perform.
Errors inbox allowed us to quickly identify multiple concurrent connection errors, where images weren’t properly downloading, making the app unusable. Errors inbox uses code checks on API integrations so that we see the errors occurring with our third-party API providers. New Relic shows the pattern of errors quickly. We are then able to cross-reference them with the open support tickets. In this case, we addressed how we were using the Cloudinary API—in a way that hadn’t been properly documented—rather than sifting through our app code base looking for issues, and were able to move through the support tickets at pace to get back to inbox zero.
New Relic as our QA team
We deploy our code quickly so that we can start using new applications as soon as possible. But that does come with a tradeoff: some of that code may need to be fixed in production. But like most non-profits, we do not have dedicated quality assurance (QA) and testing teams to take new code and run thorough analyses before we deploy. Observability in New Relic helps us keep that balance in perspective. We can address performance issues and squash the errors that arise in our edge cases while keeping the app up and running. It’s a bit like having QA staff who love to take copious notes 24/7.
Through our Observability for Good Social Impact program, we’re committed to driving equitable access to technology. We support nonprofits with free and discounted access to our observability platform and pro bono support from employee volunteers. Start now with three full platform users and 1,000 GB of data ingest for free!
Las opiniones expresadas en este blog son las del autor y no reflejan necesariamente las opiniones de New Relic. Todas las soluciones ofrecidas por el autor son específicas del entorno y no forman parte de las soluciones comerciales o el soporte ofrecido por New Relic. Únase a nosotros exclusivamente en Explorers Hub ( discus.newrelic.com ) para preguntas y asistencia relacionada con esta publicación de blog. Este blog puede contener enlaces a contenido de sitios de terceros. Al proporcionar dichos enlaces, New Relic no adopta, garantiza, aprueba ni respalda la información, las vistas o los productos disponibles en dichos sitios.


