Quickstart
Integration Features
Dashboards
Alerts
Documentation
dashboards
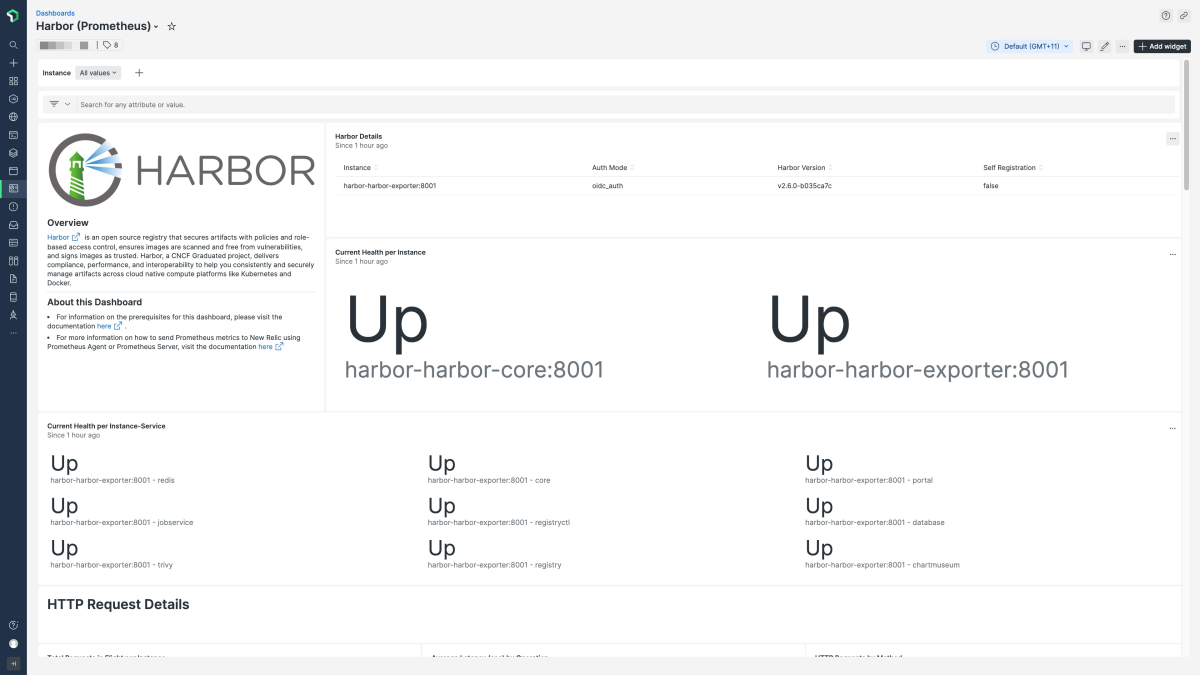
Harbor (Prometheus) quickstart contains 1 dashboard. These interactive visualizations let you easily explore your data, understand context, and resolve problems faster.
Show MoreShow Less
Harbor (Prometheus)
See all
alerts
Harbor (Prometheus) observability quickstart contains 5 alerts. These alerts detect changes in key performance metrics. Integrate these alerts with your favorite tools (like Slack, PagerDuty, etc.) and New Relic will let you know when something needs your attention.
Show MoreShow Less
1. Harbor Service Health
This alert will trigger when the health of an individual Harbor service is not 'Up' for 5 minutes.
2. Harbor Project Byte Quota Utilization
This alert will trigger when the utilization of allocated bytes for a Harbor project is >95% for 5 minutes.
3. Harbor Status
This alert will trigger when the overall health of Harbor is not 'Up' for 5 minutes.
4. Harbor Server Error Rate
This alert will trigger when the rate of 5xx responses from HTTP requests in Harbor exceeds 25 for 5 minutes.
5. Harbor Client Error Rate
This alert will trigger when the rate of 4xx responses from HTTP requests in Harbor exceeds 25 for 5 minutes.
documentation
Harbor (Prometheus) observability quickstart contains 3 documentation reference. This is how you'll get your data into New Relic.
Show MoreShow Less

