Quickstart
What is Google Cloud Spanner?
Google Cloud Spanner is a Globally-distributed relational database service built for the cloud. Add schemas, write and modify data, and run queries.
How it works
This quickstart works by using the Prometheus OTel exporter to send Spanner metrics to New Relic.
Get started!
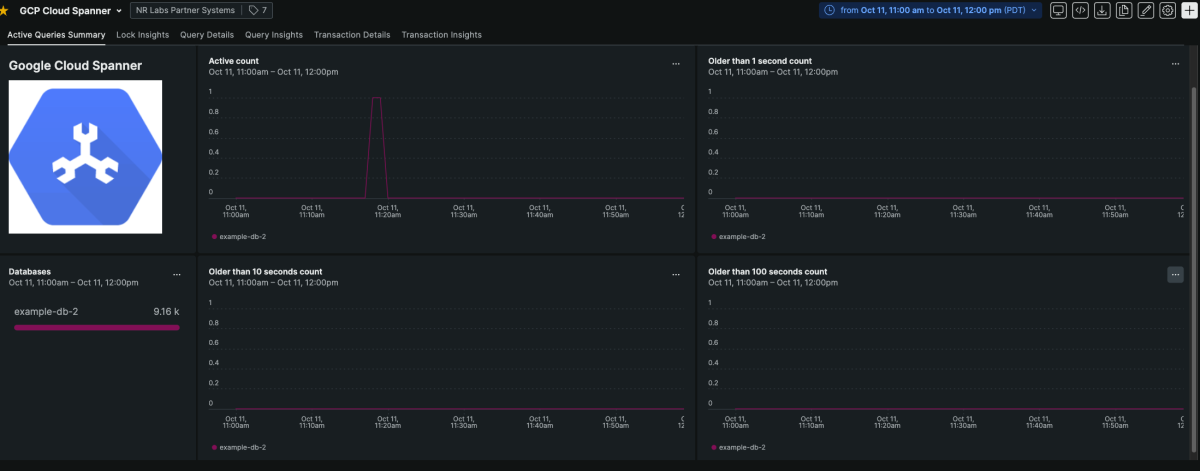
The metric data available with this quickstart pairs alongside the infrastructure monitoring quickstart for full stack observability on your cloud spanner intance. This integration focuses on Query metrics, Transaction metrics, and other DB monitoring metrics, while the infra integration focuses on monitoring the infrastructure.
About this quickstart
This integration gives you visibility into key metrics on your Spanner isntance. The metrics included give you deep insights into your Reads, queries, and transactions occuring in your cloud spanner instance.
Key Tips for using this quickstart
- The dashboard included in this quickstart works by using finding
instrumentation.source = gcpspanner.If you want to use this without changing the queries, be sure to use this as the name to identify the data source from the prometheus link. - You can add key identifying variables like project, instance, and database to your dashboard by selecting the
Add variableoption at the top of the dashboard
Need help? Visit our Support Center or check out our community forum, the Explorers Hub.


