Quickstart
What is Azure Batch?
Azure Batch is a managed service that enables you to run high-performance parallel computing jobs in the cloud. You can run compute-intensive work in a collection of virtual machines.
New Relic Azure Batch quickstart features
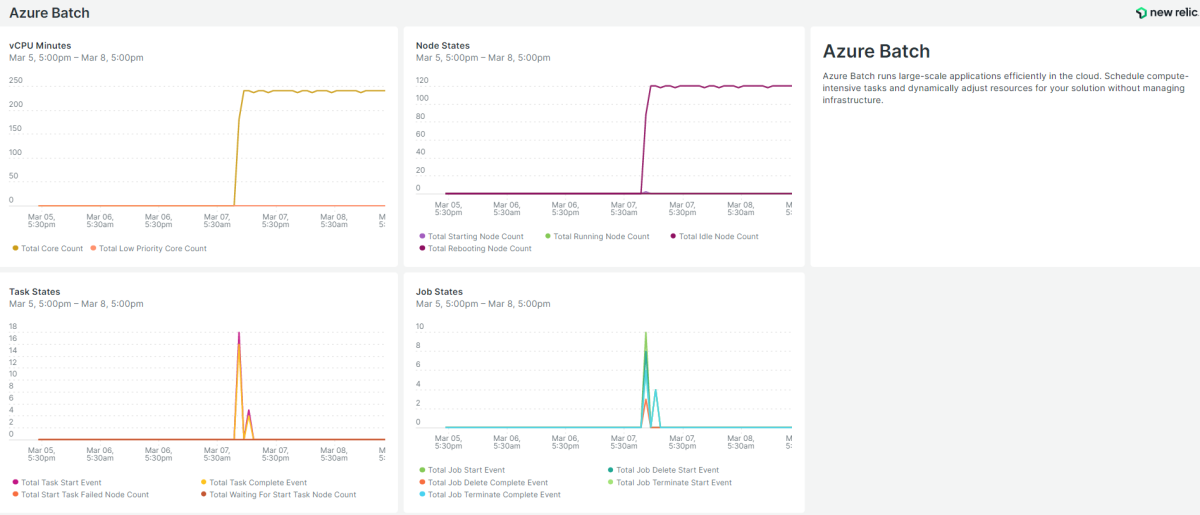
A standard dashboard that tracks key indicators like vCPU minutes, node states, job status and task status. It runs custom queries and visualizes the data immediately.
Why monitor Azure Batch with New Relic?
New Relic Azure Batch monitoring quickstart empowers you to track the performance of Azure Batch via different metrics including vCPU minutes, node states, task states and job states.
Our integration features a standard dashboard that provides interactive visualizations to explore your data, understand context, and get valuable insights.
Start ingesting your Azure data today and get immediate access to our visualization dashboards so you can optimize your Azure service.
Need help? Visit our Support Center or check out our community forum, the Explorers Hub.


