Troubleshooting Java performance bottlenecks in your Java application or service can help you better understand where you’re wasting resources with inefficient processing. Additionally, if an incident occurs, you want to know what happened during the incident and what performance issues led up to it. To make such troubleshooting faster and easier, you need to see the high-fidelity runtime characteristics of your code running on the JVM—and you need that data in real time.
To that end, New Relic is excited to announce the availability of real-time Java profiling and the JVM cluster timeline view. Because of its low overhead, you can use real-time Java profiling in production environments to run continuous profiling of your Java code. The accompanying JVM cluster timeline view provides a fast and intuitive way to diagnose cluster-wide performance problems; for example, you can now quickly see how an application’s deployment affects the overall health of the cluster.
Thanks to the Java community
The profiling data New Relic uses for real-time Java profiling comes from the contributions of the Java community. After the release of JDK 9, Oracle changed the release model of Java and open-sourced the Java Flight Recorder (JFR). (To learn more about JFR and JFR Event Streaming, check out this article from our own Ben Evans.)
Understand JVM cluster behavior over time using the cluster timeline view
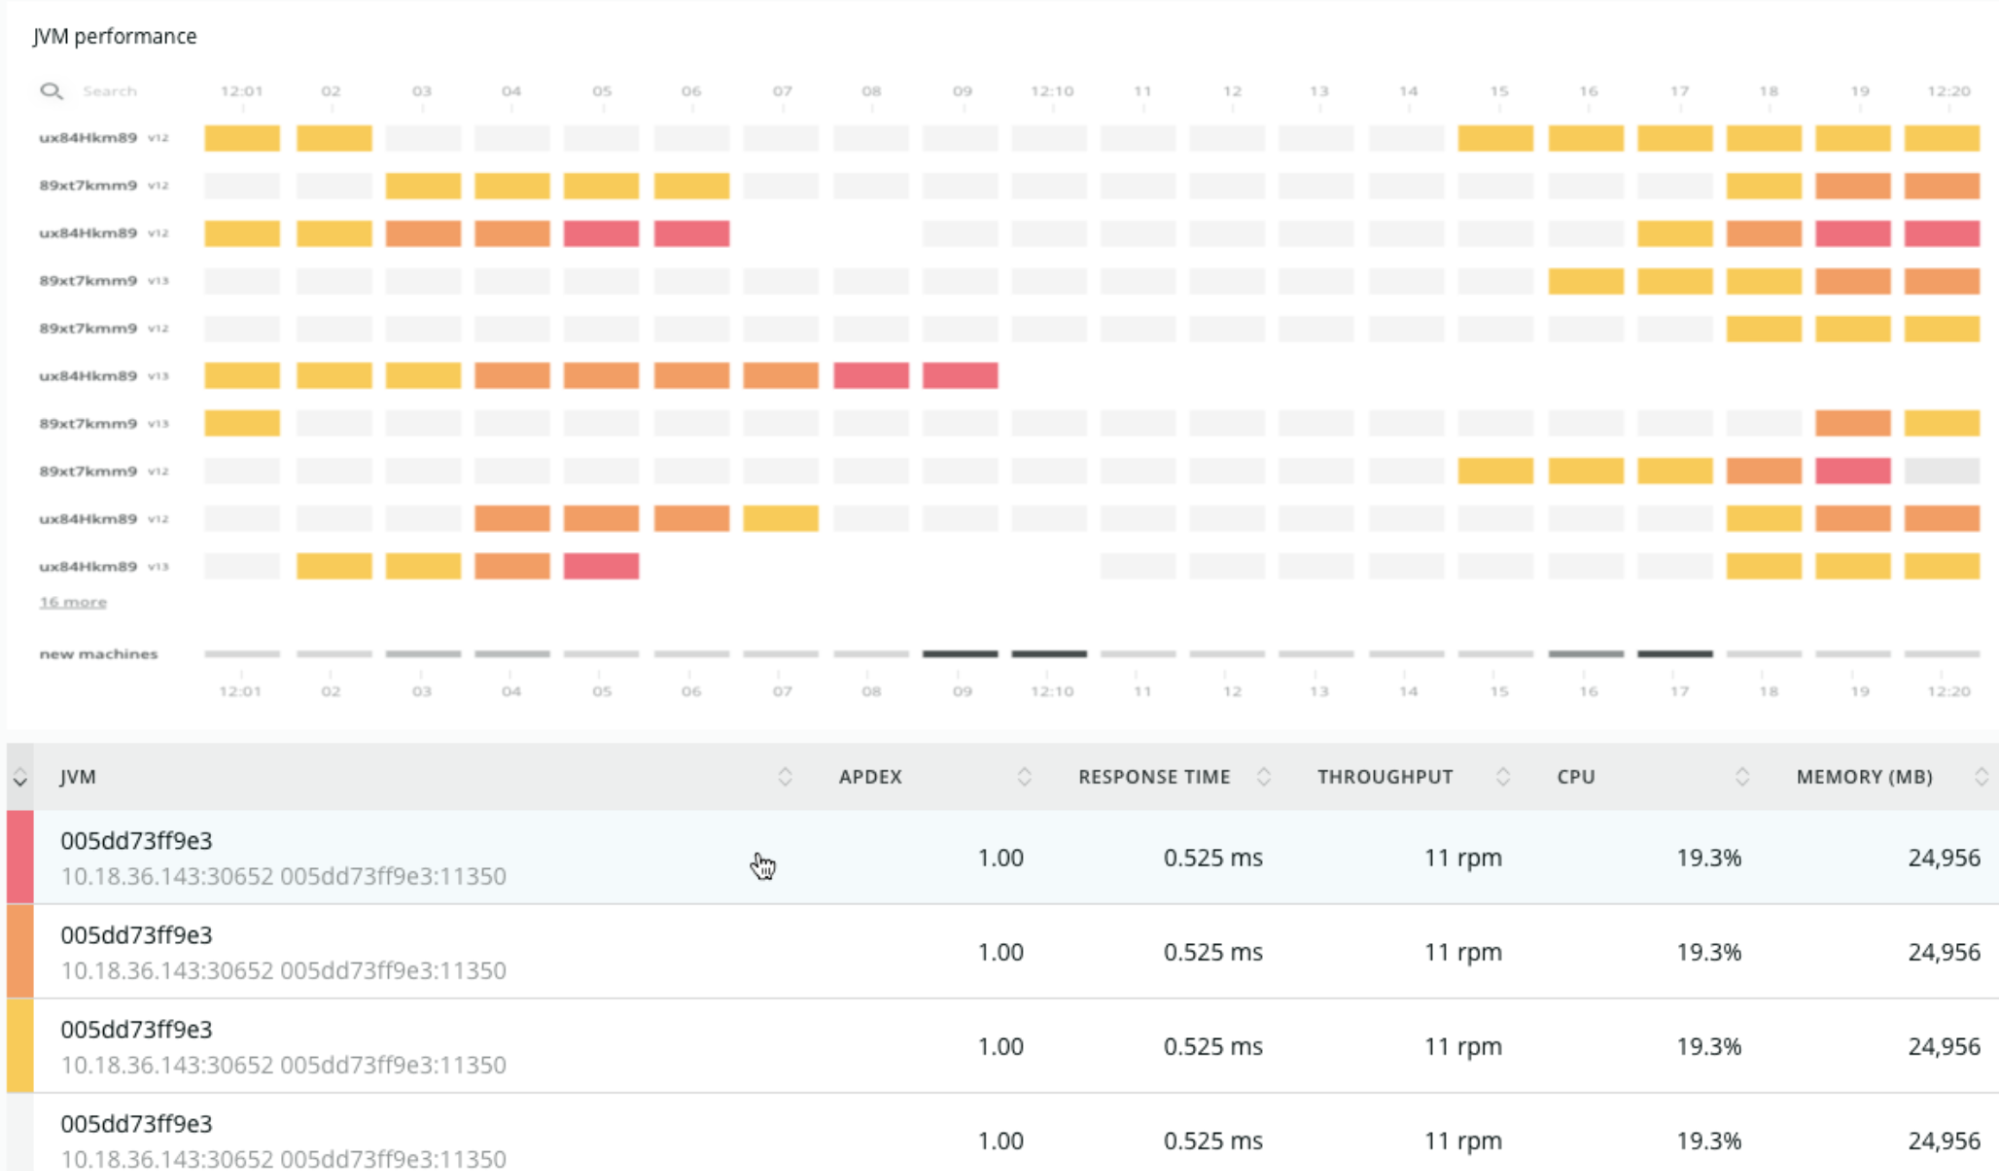
We’ve consistently heard from our customers about the need to view historic profiles across the JVM cluster supporting a service or application. So we built a unified dashboard that helps you get immediate visibility for all your JVMs to understand cluster behavior over time. This enables quicker troubleshooting and issue detection; for example, at a glance you can:
- See when a JVM was shut down or restarted
- See how instances were affected by their noisy neighbors
- See how a recent deployment affected the rest of the JVM cluster
- Go back up to 24 hours to view the root cause of incidents
Each row of the timeline represents a specific JVM over time. Inside each row, a box represents a 5-minute period of that JVM’s life. Yellow, orange, and red traffic lights indicate anomalous behavior for a JVM, so you can drill down into that instance and the right time period when investigating errors or other performance issues.
Use the details panel to get insights into your JVM
1. Debug code execution performance using flamegraphs
When debugging performance issues, you may discover that the bottleneck is in the running code. Use the flamegraphs view to find out where your application code is spending most of the execution time. This data is otherwise not available through logging or code instrumentation. You can use this to directly work on optimizing the hot spots in your code.
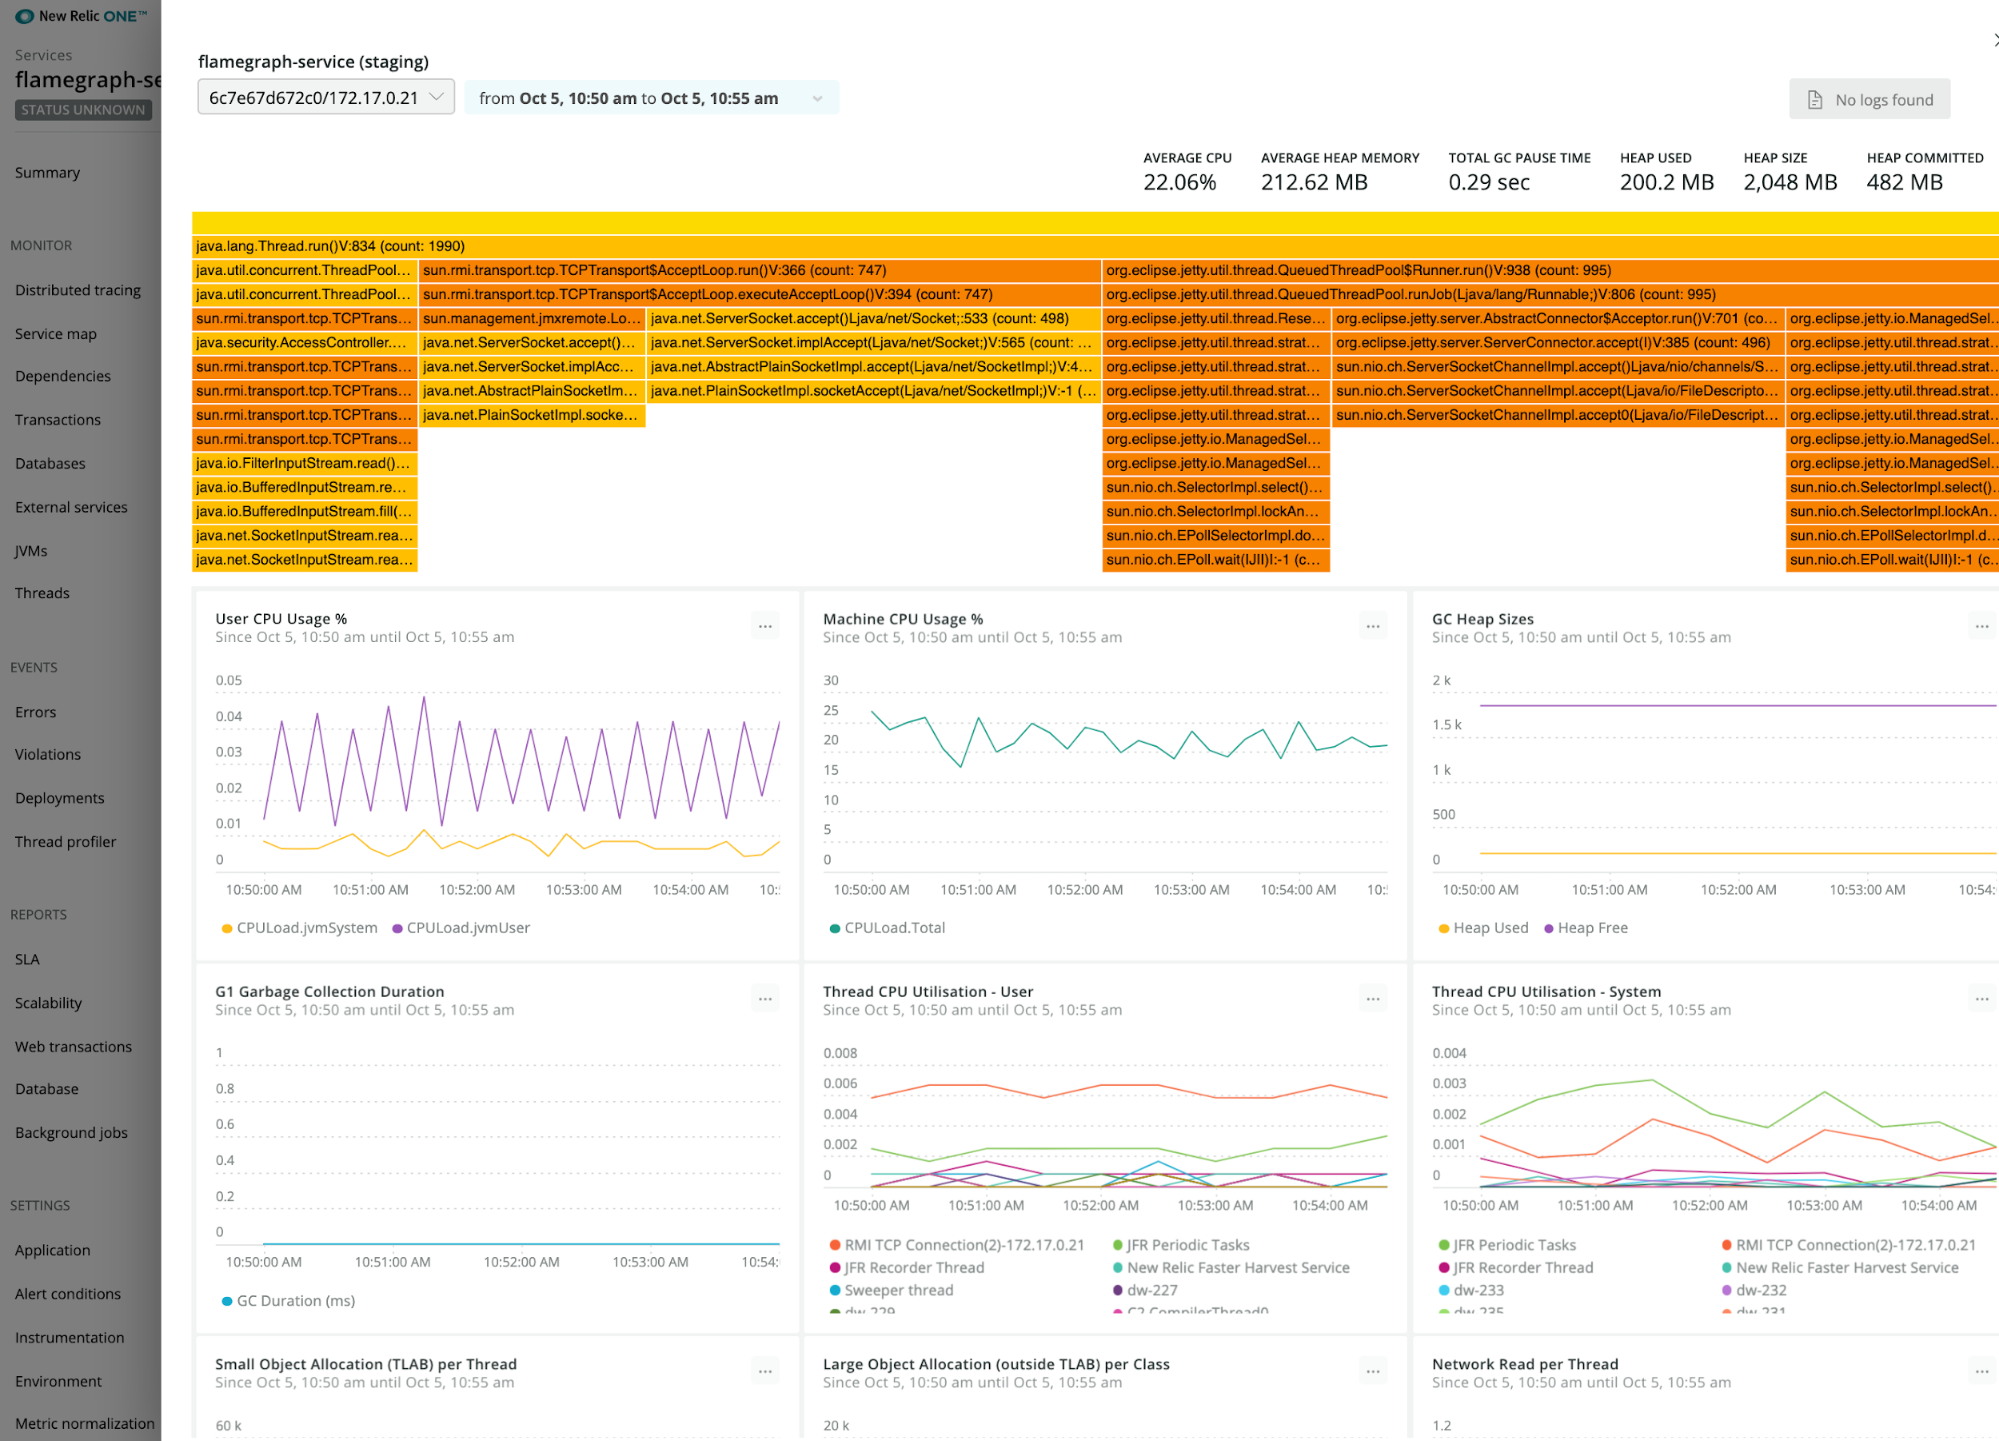
2. How resources are allocated within a process
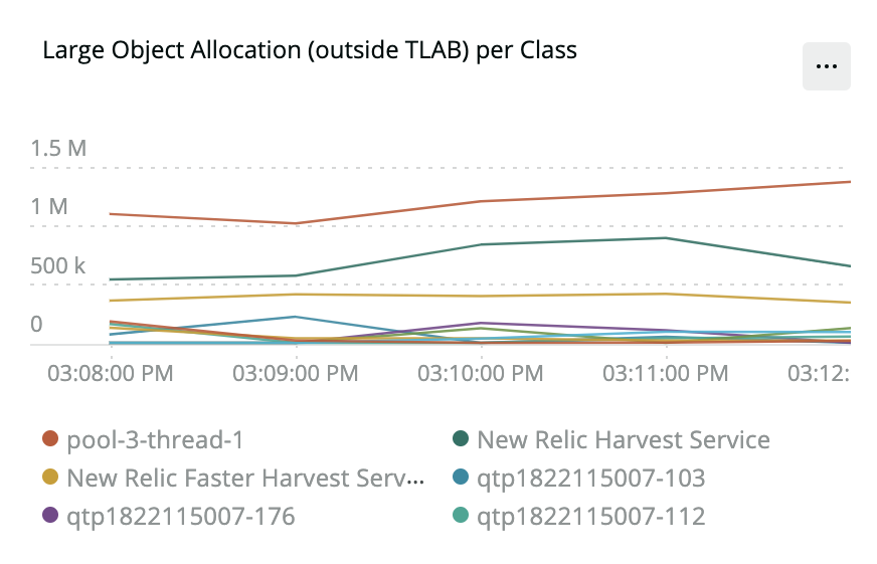
In the detailed view of a JVM, the per-thread allocation buffer (TLAB) allocations graph shows you which threads are allocating the most resources. From this graph, you can see the individual events where new allocation buffers are handed out to application threads, which provides a much more accurate view of resources within a process.
3. Find inefficient garbage collection
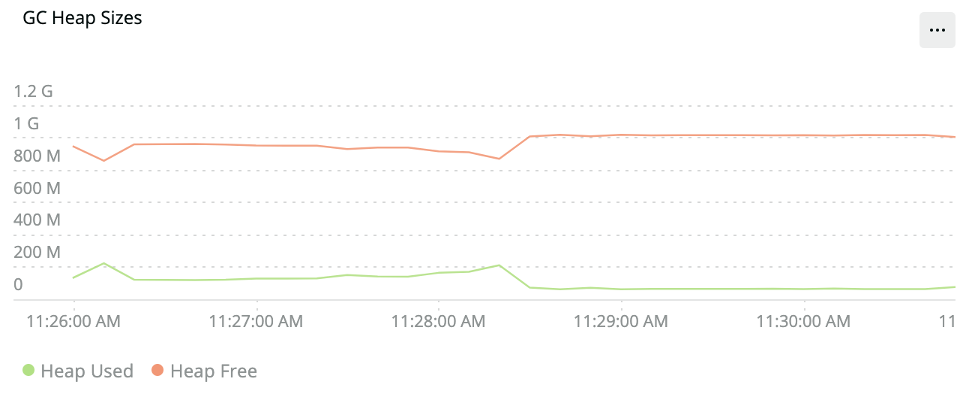
The main performance problems with garbage collections (GCs) are usually either that individual GCs take too long, or that too much time is spent in paused GCs (total GC pauses). The garbage collection (GC) graph shows garbage collection events over the lifetime of a JVM. The longest pause indicates where long garbage collection events have occurred over the selected time period while the overall time shows the total time spent in GC within a given time period.
4. Connect profiling data with Logs
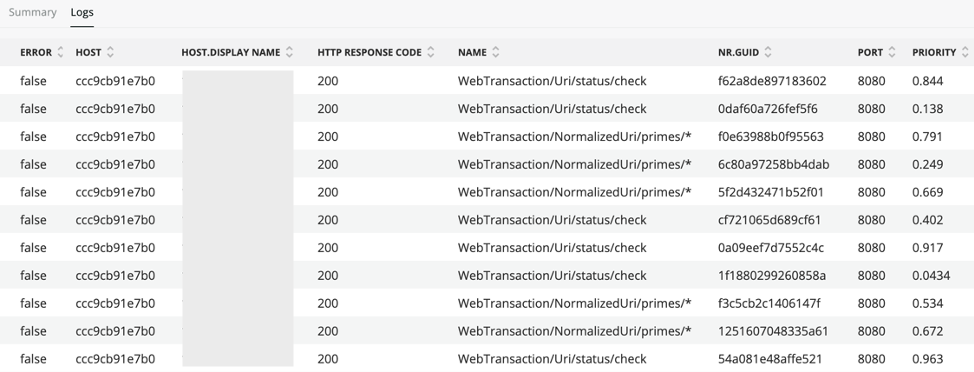
If you’ve enabled New Relic Logs, you can view logs for your Java application with data from the garbage collection graph to find transactions caught up in long garbage collection pauses.
Get started with real-time profiling for Java in New Relic One
Real-time profiling for Java and the cluster timeline view are available in New Relic One, where you can incorporate this real-time profiling with other critical observability data.
To learn more about requirements and how to get started, check out the documentation. We work in the open, you can view the source code in GitHub. If you have any feedback, let us know.
Want to learn more about what’s happening in the Java ecosystem? Don’t miss The State of Java: Trends And Data For One of the World’s Most Popular Programming Languages.
이 블로그에 표현된 견해는 저자의 견해이며 반드시 New Relic의 견해를 반영하는 것은 아닙니다. 저자가 제공하는 모든 솔루션은 환경에 따라 다르며 New Relic에서 제공하는 상용 솔루션이나 지원의 일부가 아닙니다. 이 블로그 게시물과 관련된 질문 및 지원이 필요한 경우 Explorers Hub(discuss.newrelic.com)에서만 참여하십시오. 이 블로그에는 타사 사이트의 콘텐츠에 대한 링크가 포함될 수 있습니다. 이러한 링크를 제공함으로써 New Relic은 해당 사이트에서 사용할 수 있는 정보, 보기 또는 제품을 채택, 보증, 승인 또는 보증하지 않습니다.


