This article was originally published on OpenTracing.
As one of the folks leading our distributed tracing project at New Relic, I use the word “tracing” so often that sometimes I joke that it’s lost all meaning for me. But words matter, and this one is particularly important because “tracing” can refer to many different things.
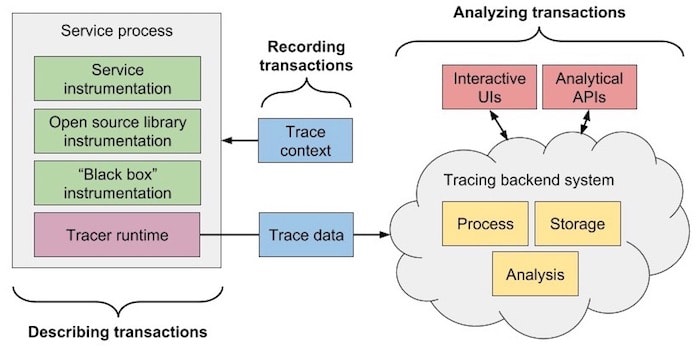
Our distributed tracing project spans the entire New Relic engineering organization, from eleven language agents to our data ingest tier, through processing and storage and finally to our many frontend UIs. As we began planning for our next generation of tracing, I found myself grasping for a way to explain that this big, unwieldy project could be broken up into independent problems: the data collection, the propagation, and the display.
While separate, these domains are also related (and we’re calling all of it “distributed tracing”) so it was challenging to explain to everyone involved with the project. Some people knew we’d announced support for OpenTracing but weren’t sure what that got us, exactly. At the point we started talking about other CamelCase projects like TraceContext and OpenCensus, eyes were glazing over.
Each of these standards projects is solving a distinct problem that we collectively call “tracing.” In February I attended a distributed tracing workshop where Ben Sigelman captured these distinctions by asking and answering, “What’s the difference between tracing, tracing, and tracing?” With his permission, I’ll present that framework here and explain why we’re excited to participate in the emerging distributed tracing standards.

Tracing is about analyzing transactions
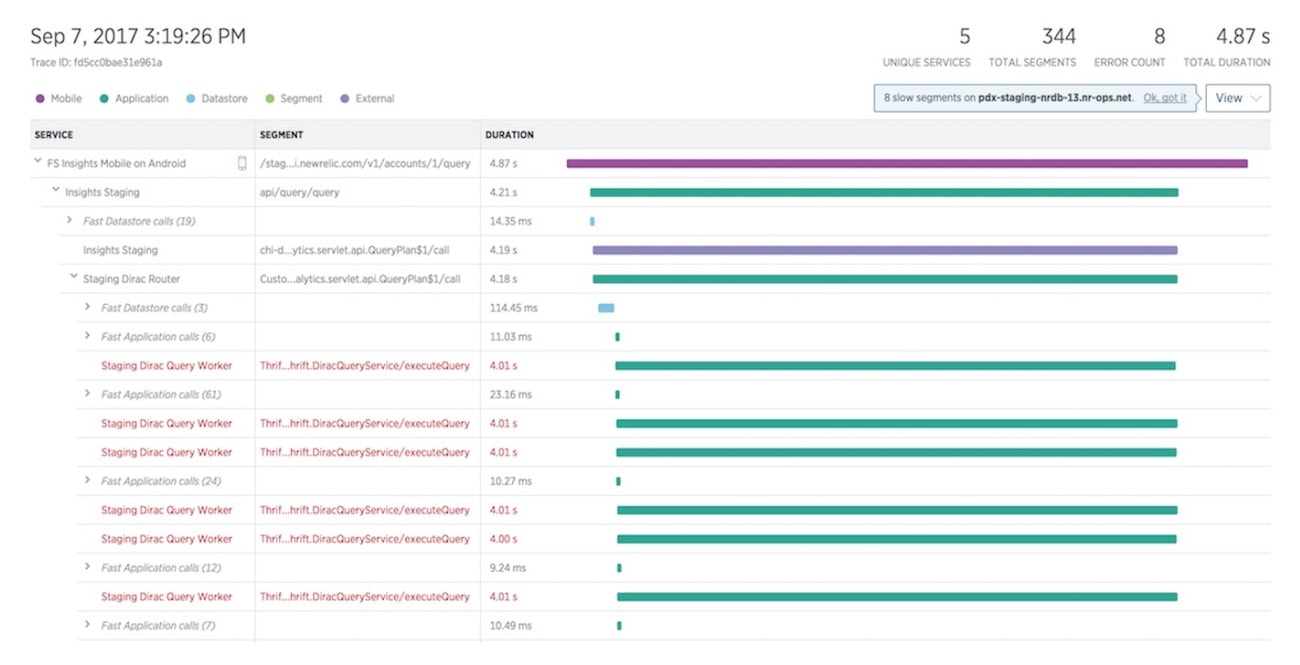
Tracing is how you monitor your system and get insights into its performance. We joined the growing list of APM vendors with tracing support with our own visualizations at our FutureStack conference last fall.
All the effort to collect traces would be wasted if we couldn’t show it in a useful way for customers. From the basics of just stitching together a particular trace to learning why it was slow to showing historical trends for a particular workflow through the hottest point in your ingest pipeline to using machine learning to figure out patterns within your system — visualizing traces is very important. Most APM vendors, New Relic included, plan to differentiate themselves from their competitors in this domain.

Tracing is about recording transactions
Tracing is how you keep track of lots of transactions. Essentially, using context that comes into a service with a request, some kind of tracer propagates that context to other processes and attaches it to transaction data sent to a tracing backend. This context allows the transactions to be stitched together later.
New Relic already does this today with cross-application tracing. With the industry shifting from monoliths to microservices, it’s becoming increasingly important to track transactions across process boundaries where APM agents can’t be installed. We’re actively participating in the new w3c distributed tracing trace context format working group (i.e., the standard for how to pass around tracing information).
With more services and more clouds, there’s more trace context passing through points where it could be lost. We’re joining the trace context standard so that when your request starts in a system monitored by New Relic and passes into a system monitored by AWS, the header propagating the context won’t be dropped and the trace won’t be broken.
Tracing is about describing transactions
Tracing is how you measure transactions. What happened and how long did it take? This is how New Relic has defined “tracing” for a long time. Our agents already trace transactions, errors, and slow queries within applications so customers can see where the slow parts are.
Our agent teams have become experts in language-specific application frameworks in order to create meaningful traces. If framework and library authors include their own instrumentation, we don’t have to track and update agents with each release. If that instrumentation is also vendor-neutral, it encourages more widespread adoption and lowers switching costs.
The OpenTracing project explicitly tries to solve this problem with a general-purpose tracing API. To broaden the ways customers can send us data, we’re updating our agents to support these API calls and translate the data into our own formats.
We’re joining the OpenTracing standard to scale our instrumentation support and make it easier for customers to choose New Relic for their monitoring. We believe software benefits from well-instrumented applications that help engineers diagnose and fix problems quickly, and we want everybody to benefit from the increased level of visibility that apps with well-instrumented APM solutions provide.
Defining our terms
By separating the concerns, we can consider the unique users of each tracing domain. Ops end-users care about the UIs and APIs we provide to interact with and analyze their data. Dev end-users care about our instrumentation APIs and performance. DevOps end-users care about both! (And no one really cares about tracing context propagation unless it’s obtrusive or doesn’t work.)
Tracing standards projects don’t always neatly fall into these categories. Projects like OpenCensus aim to standardize across both the describing and recording domains with APIs for metrics and tracing instrumentation, and there are all-in-one projects like Zipkin that describe, record, and analyze distributed traces. But defining our terms and problem domains reduces confusion about what each standard is (and is not) and allows us to reason better about the specific problems they solve and how they can work together.
이 블로그에 표현된 견해는 저자의 견해이며 반드시 New Relic의 견해를 반영하는 것은 아닙니다. 저자가 제공하는 모든 솔루션은 환경에 따라 다르며 New Relic에서 제공하는 상용 솔루션이나 지원의 일부가 아닙니다. 이 블로그 게시물과 관련된 질문 및 지원이 필요한 경우 Explorers Hub(discuss.newrelic.com)에서만 참여하십시오. 이 블로그에는 타사 사이트의 콘텐츠에 대한 링크가 포함될 수 있습니다. 이러한 링크를 제공함으로써 New Relic은 해당 사이트에서 사용할 수 있는 정보, 보기 또는 제품을 채택, 보증, 승인 또는 보증하지 않습니다.


