Why are your end-to-end tests taking so long to execute? Is it a browser-specific thing? Maybe the version of the framework you’re using has performance issues? How easily can you track test coverage if you work with hundreds of different services?
At New Relic, we use data and our own product to help answer these questions. This blog post outlines some of the steps we’ve taken to collect and use test data. The techniques and information provided here can also be useful regardless of the test tools you are using.
Let’s dive into the specifics: what you need, and what you can do with this sort of data. I hope this inspires you and your teams to start this journey.
Sending custom events to New Relic
You can send all sorts of custom events to New Relic via our event API. By doing this with testing related events, you will have data stored in your New Relic database, all the power of our New Relic Query Language (NRQL) language to deep dive into this data, and answers to your questions around test coverage and execution.
In order to use the API and start generating data, you’ll need to follow three steps:
- Generate a new license key for the account you want to report data to.
- Generate JSON for the event by instrumenting your application test runners, APIs, or other methods.
- Submit a compressed JSON payload to the HTTPS endpoint in a POST request.
Your JSON payload may look something like this:
[
 {
   "eventType": "Coverage",
   "releaseTag": "release-308",
   "repository": "your-awesome-project-repo",
   "teamId": "101",
   "Coverage": 98.77
   "Covered": 325659
   "Missed": 4055
 }
]
The type of events and data you choose to persist is important and depends on the context of each company and project. In the next sections, we’ll review the test events New Relic stores to give you some inspiration.
Code coverage insights
At New Relic we track code coverage information for both backend and frontend code repositories. We automatically report events to New Relic with code coverage data through plug-ins and our own internal version of the New Relic CLI. Under the hood, we send this data using the event API previously mentioned. This information is submitted after merging pull requests to the main branch.
To view the latest reported events, teams can use the following NRQL query:
SELECT * FROM Coverage SINCE 1 month ago
Understanding code coverage metrics
This is a non-extensive list of useful data we track for backend code coverage events:
- Coverage: Quantifies the percentage of code that's been tested, serving as a key indicator of your codebase's test completeness.
- Covered: Counts the specific sections of code your tests have successfully executed.
- Missed: Points out the untested parts, signaling potential risk areas.
- Release tag: Specifies the release tag; this is useful for tracking coverage per version.
- Repository: Stores the code repository name that generated the event.
- Owning team: Stores the team name that owns the code repository.
For UI experiences, we generate two additional coverage metrics:
- Unit test coverage: Quantifies the percentage of code that’s been tested with unit tests.
- End-to-end coverage: Quantifies the percentage of code that’s been tested with end-to-end tests.
It's important to select the coverage metric (like instructions or lines) that aligns with your project goals and provides meaningful insights into your testing strategy.
Playwright end-to-end testing: Metrics that matter
We use Playwright as our standard web end-to-end testing framework, integrated with our internal version of the command-line interface (CLI). Here we have more interesting events to track.
A non-extensive list of useful data we track on each of the end-to-end events is presented below. All this information can be used further to refine and filter your dashboards, join data with other tables, and more.
- Annotation: Test annotations. This is useful for filtering, finding slow tests, and more.
- Base URL: What URL was used to start the test.
- Browser name: Browser name with which the test was executed.
- Build number: Build number of the application under test where the test was executed.
- Duration: Test case duration.
- Environment: Execution environment (development, staging, etc.).
- Error message: Set when error (or its subclass) has been thrown.
- Error stack: Set when error (or its subclass) has been thrown.
- Error value: The value that was thrown. Set when anything except the error (or its subclass) has been thrown.
- Outcome: Test case outcome.
- Playwright version: Version of Playwright used when executing this test.
What do we do with all the data?
Having all this testing related data is just the tip of the iceberg. What our teams do with it is super important! All this information is aggregated and shared via our dashboard features. Here are a few use cases that may inspire you and your teams:
Reducing test flakiness with data
A flaky test is defined as a test that exhibits non-deterministic behavior: it could pass or fail when running multiple times, with no change to the code being tested or the test code itself.
Flaky tests have lots of impact on resource utilization, valuable developer time, and erode trust in your testing suites.
One of the test metrics we track is the test case outcome. An outcome in Playwright can have the following values:
testCase.outcome(): "skipped"|"expected"|"unexpected"|"flaky";
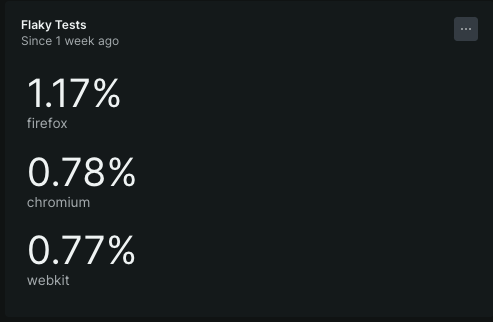
A test that passes on a second retry is considered “flaky.” Having this instrumentation allows us to keep track and pinpoint specific flaky tests, which is the first step to get them under control. For example, the following query calculates a percentage of tests marked as flaky, and then facets the results by browser name.
SELECT percentage(count(*), WHERE (outcome = 'flaky')) FROM E2ECoverageReport LIMIT MAX FACET browserName

You could also visualize flaky tests as a time series, considering a longer time period, with a query like the following:
SELECT percentage(count(*), WHERE outcome = 'flaky') FROM E2ECoverageReport FACET browserName TIMESERIES SINCE 1 year ago LIMIT MAX

We find this super useful to quickly visualize if all the actions your teams are taking to reduce flakiness are working as expected.
Enhancing end-to-end test performance
Keeping end-to-end tests running as fast as possible, and thus your continuous integration, continuous deployment (CI/CD) pipeline, is important. There are multiple actions that teams can take to achieve this goal, such as optimizing tests and test execution parallelization. Tracking duration is a must to experiment and measure the outcomes of such improvements.
Consider the following query, where duration is the total execution time in milliseconds.
It makes use of NRQL aggregation functions like average, median and percentile to calculate values:
FROM E2EStats SELECT average(duration / 1000) as 'avg test time (secs)', median(duration / 1000) as 'median test time (secs)', percentile(duration / 1000, 95) as 'percentile test time (secs)' WHERE repoName \= 'ono-sendai-test' FACET browserName SINCE 1 month ago

An example outcome in our organization: We upgraded our test infrastructure from Amazon EC2 C5 to C7i instances, which significantly improved our Playwright test suites' execution time. This change resulted in a 30% speedup while maintaining similar costs. Having access to test duration data made it easy to identify the issue and measure the improvements.
Data-driven governance for leadership
Keeping track of your company’s quality standards as a leader of multiple teams is easier when you have the right data in place. Teams usually own a wide variety and number of services. Therefore it’s handy to visualize all your testing metrics in a centralized way. This allows you to track compliance, identify potential gaps in code coverage, and identify opportunities to improve your overall testing activities. Using this approach enables you to make informed decisions about increasing your investment in testing. This can lead to fewer incidents, reduced risk, faster lead times, and a possible reduction in the rate of change failures.
Empowering teams with custom dashboards
Having one single place where your teams and other teams can quickly refer to test data fosters empowerment and collaboration. As a platform team you can provide dashboards that can be filtered by team, repository, or service via template variables. At the same time, teams can build their own, more specific dashboards for their own needs.
Best practices and common pitfalls to avoid while building them is out of scope for this blog post. To learn more about this topic, please refer to our dashboards documentation.
The synergy of testing, observability, and DevOps
By tracking coverage, flakiness, and performance, we not only improve our testing strategies but also empower teams to make data-driven decisions. Observability practices are important to follow across all stages of your software delivery lifecycle. Testing activities are not an exception. As a matter of fact, there is a strong relationship between testing, observability, and DevOps. This concept is known by the acronym TOAD. To learn more about TOAD, refer to Chris McMahon’s series of blog posts.
Test observability is a game-changer, transforming data into actionable insights that enhance our code's quality and robustness. If you haven't started yet, it’s never too late. I hope this blog post encourages you and your teams to start or continue improving this journey. Happy testing!
다음 단계
Ready to start tracking your test-related events with New Relic?
- If you haven't already, sign up for New Relic for free.
- Understand the event API to start sending your data.
- Learn how to report custom event data.
These resources will help you integrate New Relic with your testing processes and start benefiting from data-driven insights.
이 블로그에 표현된 견해는 저자의 견해이며 반드시 New Relic의 견해를 반영하는 것은 아닙니다. 저자가 제공하는 모든 솔루션은 환경에 따라 다르며 New Relic에서 제공하는 상용 솔루션이나 지원의 일부가 아닙니다. 이 블로그 게시물과 관련된 질문 및 지원이 필요한 경우 Explorers Hub(discuss.newrelic.com)에서만 참여하십시오. 이 블로그에는 타사 사이트의 콘텐츠에 대한 링크가 포함될 수 있습니다. 이러한 링크를 제공함으로써 New Relic은 해당 사이트에서 사용할 수 있는 정보, 보기 또는 제품을 채택, 보증, 승인 또는 보증하지 않습니다.


