Red Hat OpenShift is a managed Kubernetes platform that allows you to build and deploy container-based applications rapidly while alleviating the time-consuming process of managing clusters. OpenShift provides a host of services for managing Kubernetes clusters, including an integrated container registry and a container host and runtime built on Red Hat Enterprise Linux CoreOS.
While OpenShift makes it easier to launch and run Kubernetes, the ephemeral nature of Kubernetes-based workflows means you need advanced monitoring at the cluster, node, pod, container, and application levels.
The New Relic Kubernetes integration gives you these infrastructure-centric and application-centric views into your clusters. The Kubernetes integration reports on data and metadata about the nodes, namespaces, deployments, ReplicaSets, pods, clusters, and containers running in OpenShift, so you can fully monitor the frontend and backend applications and hosts running in your cluster. Monitoring OpenShift with New Relic provides total visibility, alerting, and dashboards for all Kubernetes entities that live among your applications.
Installing New Relic on OpenShift
As an officially certified OpenShift partner,New Relic Infrastructure is available through the Red Hat Container Catalog. Once you have an OpenShift cluster running, follow these steps to install the New Relic Kubernetes integration:
- Edit your OpenShift security context constraints and add the
newrelicservice account:
oc adm policy add-scc-to-user privileged \

system:serviceaccount:<YOUR NAMESPACE>:newrelic
Note: Be sure to update
<YOUR NAMESPACE>with the correct value. - New Relic uses kube-state-metrics—a simple service that listens to the Kubernetes API server and generates metrics—to gather information about the state of Kubernetes objects. Install kube-state-metrics in your cluster:
curl -o kube-state-metrics-1.5.zip https://codeload.github.com/kubernetes/kube-state-metrics/zip/release-1.5 && unzip kube-state-metrics-1.5.zip && oc apply -f kube-state-metrics-release-1.5/kubernetes
- Download the Kubernetes integration configuration file:
curl -O https://download.newrelic.com/infrastructure_agent/integrations/kubernetes/newrelic-infrastructure-k8s-latest.yaml
- In the configuration file, add your New Relic license key and a cluster name to identify your Kubernetes cluster. Both values are required. Be sure to update
<YOUR_LICENSE_KEY>with your license key and<YOUR_CLUSTER_NAME>with the name of your cluster.
env:

- name: NRIA_LICENSE_KEY

  value: <YOUR_LICENSE_KEY>

- name: CLUSTER_NAME

  value: <YOUR_CLUSTER_NAME>
- Still in the configuration file, in the securityContext: section, add a
privileged: truesetting to be run and deployed in the default namespace:
spec:

      serviceAccountName: newrelic

      containers:

            - name: newrelic-infra

              image: newrelic/infrastructure-k8s:1.0.0

        securityContext:

         privileged: true

      resources:

      limits:

      memory: 100Mi
Information about additional installation settings can be found in New Relic’s OpenShift and Kubernetes integration documentation.
Starting the New Relic Kubernetes integration
The New Relic Infrastructure agent is installed as a Kubernetes DaemonSet, which ensures that the New Relic Kubernetes integration is automatically running on each node in your OpenShift cluster.
- To create the DaemonSet:
oc create -f newrelic-infrastructure-k8s-latest.yaml
- Check that the DaemonSet is running:
oc get daemonsets
The result should report that
newrelic-infrais ready, up-to-date, and available. - Check that kube-state-metrics is running:
oc get pods --all-namespaces | grep kube-state-metrics
The results should report that
kube-systemis running.
Examining your OpenShift Kubernetes cluster
After you ensure kube-state-metrics is running, you’re ready to examine your cluster. Navigate to New Relic Infrastructure, and in the menu bar, click Kubernetes.
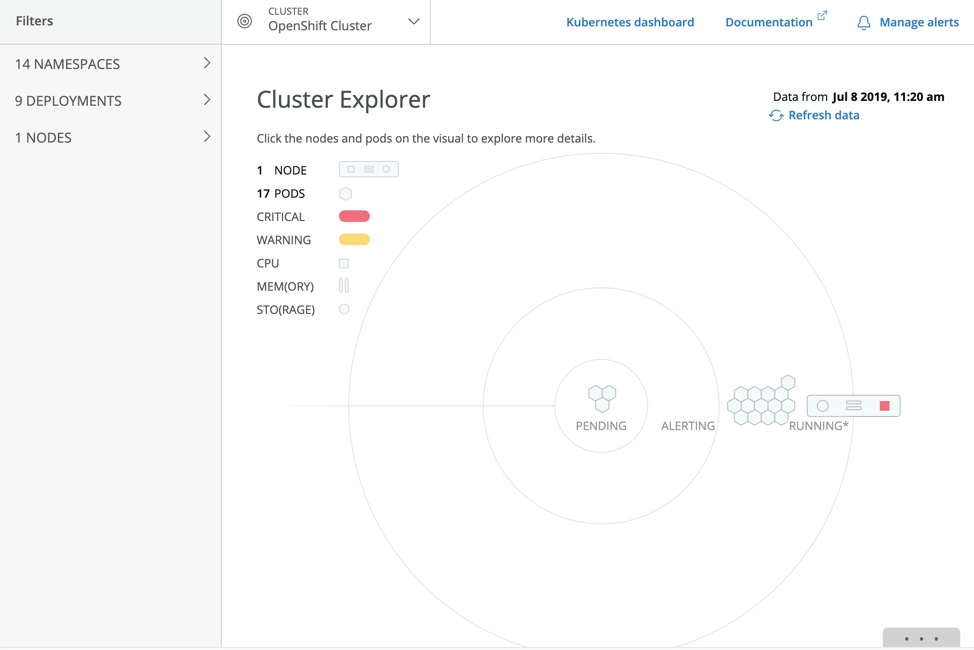
This opens the New Relic Kubernetes cluster explorer, which shows all the pods, namespaces, deployments, and nodes in your OpenShift environment:
Tip: For more information about the cluster explorer, check out Kubernetes Cluster Explorer: Multidimensional Monitoring for Running Kubernetes at Scale Kubernetes.
If you’re a cluster operator, platform engineer, or application developer, you can use the New Relic Kubernetes cluster explorer to:
- Locate and drill down to the pods you care about most. The cluster explorer allows you to filter by namespace, deployment, node, and cluster.
- Track resource requests and resource limits. Use data gathered in New Relic to accurately plan your capacity and understand which teams are consuming the most resources in your cluster.
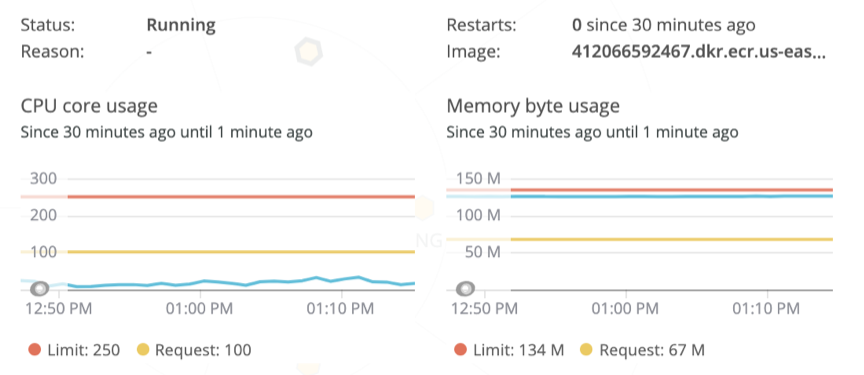
Track essential cluster resources with the cluster explorer.
- Alert on high resource consumption. The Kubernetes integration sets up a default alert policy for your cluster, so you can be notified if pods are reaching resource consumption limits. For example, if any pods in your cluster are reaching 90% of their memory limit, depending on the alert conditions you set, they will be highlighted in yellow or red. To see the default alert policies, navigate to alerts.newrelic.com, click Alert policies, and search for Kubernetes default alert policy.
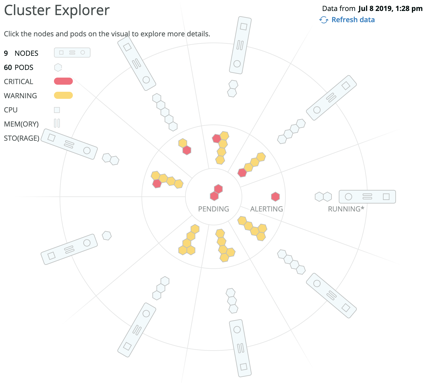
Pods in the cluster explorer showing alert conditions.
See the Kubernetes integration documentation for more information about the data and metadata about nodes, namespaces, deployments, clusters, pods, and containers the integration reports to New Relic.
Examine APM data about the applications running in your OpenShift clusters.
At this point, you’ll want to correlate the performance of your applications with your OpenShift infrastructure, by linking your New Relic APM data with your OpenShift data (learn how in the documentation). This step provides deep application performance monitoring (with code instrumentation and distributed tracing) for the applications running in your cluster.
After you’ve linked your applications, click any of the hexagons in the cluster explorer—which represent pods in your cluster—to open the pod details view from where you can analyze the performance of applications running in that pod.
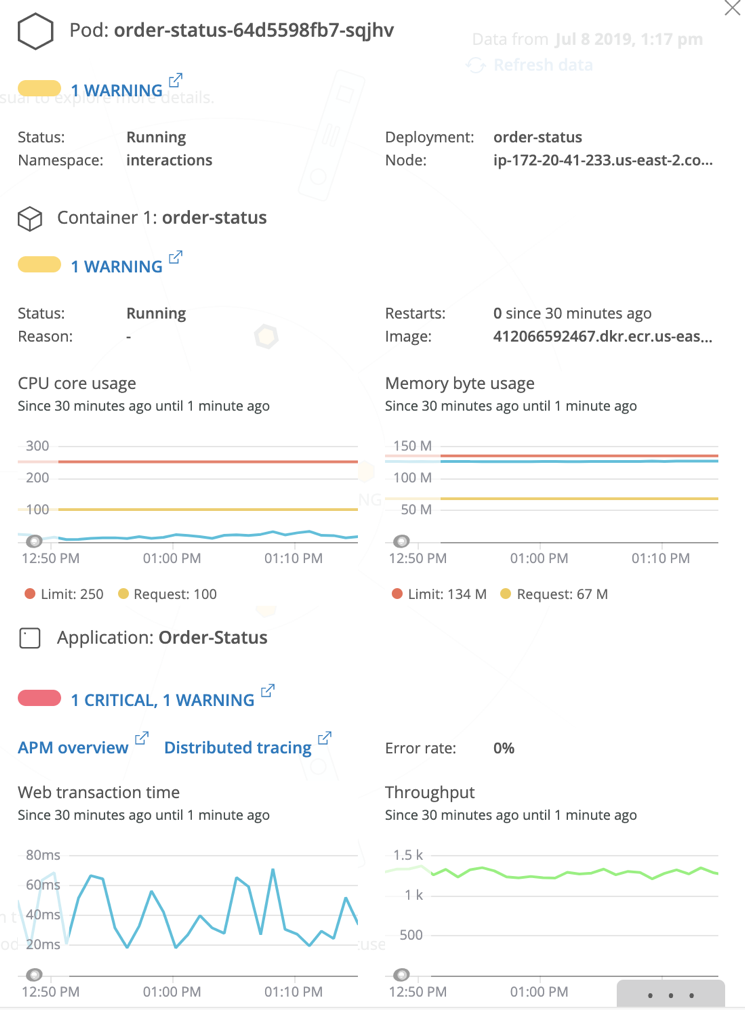
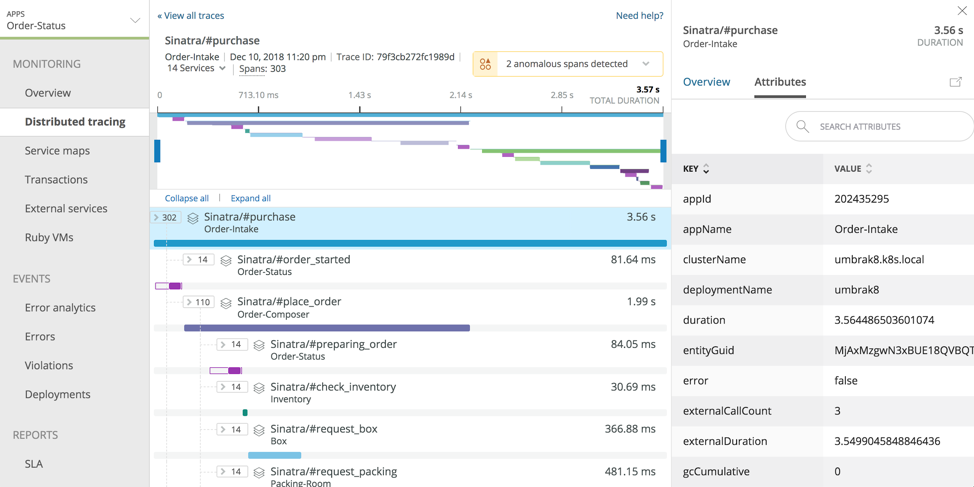
From the pod details, click APM overview to get a detailed view of the application running in that pod, which you can use to investigate transaction traces and errors from the applications in your OpenShift environment. Or click Distributed tracing to inspect the distributed traces captured for the application running in that pod. If you click on an individual span in a distributed trace, you can quickly see the relevant Kubernetes attributes for that application; for example you can find out which pod, cluster, and deployment an individual span belongs to.
The New Relic Kubernetes integration is available to all New Relic Infrastructure customers at the Pro level. Learn more in our Kubernetes integration documentation and our OpenShift-specific documentation.
If you don’t have a New Relic account yet, sign up for a 30-day free trial, and get started monitoring your OpeShift cluster in less than five minutes.
이 블로그에 표현된 견해는 저자의 견해이며 반드시 New Relic의 견해를 반영하는 것은 아닙니다. 저자가 제공하는 모든 솔루션은 환경에 따라 다르며 New Relic에서 제공하는 상용 솔루션이나 지원의 일부가 아닙니다. 이 블로그 게시물과 관련된 질문 및 지원이 필요한 경우 Explorers Hub(discuss.newrelic.com)에서만 참여하십시오. 이 블로그에는 타사 사이트의 콘텐츠에 대한 링크가 포함될 수 있습니다. 이러한 링크를 제공함으로써 New Relic은 해당 사이트에서 사용할 수 있는 정보, 보기 또는 제품을 채택, 보증, 승인 또는 보증하지 않습니다.

