Between the constant dev releases you need to support and all the new tools and technologies you need to adopt to keep things up and running, an alert at 3 a.m. is the last thing you want to see. New Relic Infrastructure was built for navigating this dynamic, fast-paced world—with the ultimate goal of helping ops teams increase mean time between loss of sleep (MTBLS).
With real-time visibility into every metric and event on any host across your infrastructure (whether that includes AWS, Docker, bare metal or all of the above), New Relic makes it easy to scale rapidly, deploy intelligently, and be more proactive about infrastructure monitoring.
Key benefits
New Relic Infrastructure delivers real-time health metrics correlated with recent configuration changes to help you:
- Reduce mean time to detection (MTTD) and resolution (MTTR)
- Ensure uptime and consistency across your infrastructure, whether cloud, on-prem, or hybrid
- Deploy with greater confidence knowing exactly what's going on in your environment
- Accelerate time to value—with built-in native support for AWS products, there's no config required
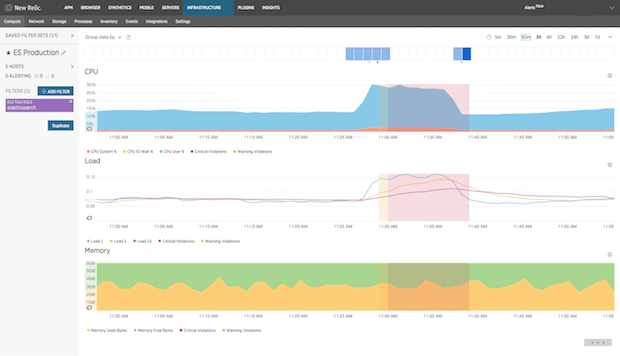
Real-time health metrics for all your systems
With DevOps and Agile practices come more frequent code deploys and more changes—updates that you and your team need to stay on top of to avoid potential issues. With New Relic, you’ll know exactly where changes are happening and when.
- Easy correlation between config change events and health metrics
- Key host health metrics (CPU, memory, disk, network) refreshed every five seconds
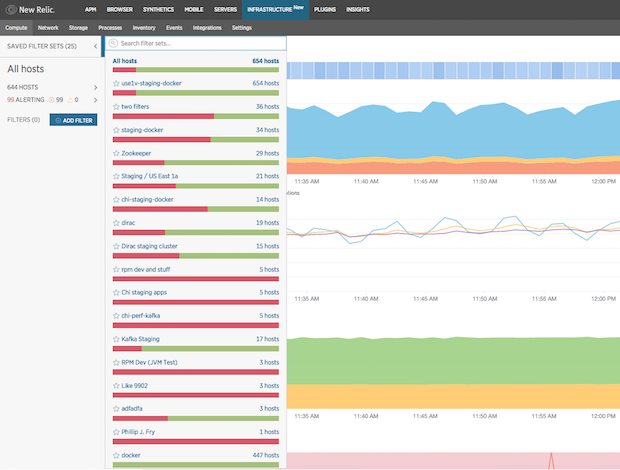
- Custom querying and dashboards to improve collaboration across dev, ops, and other teams
- Slice and dice Docker containers by labels, images, and other metadata
For more ways to track metrics with infrastructure monitoring and APM, try ZenHub

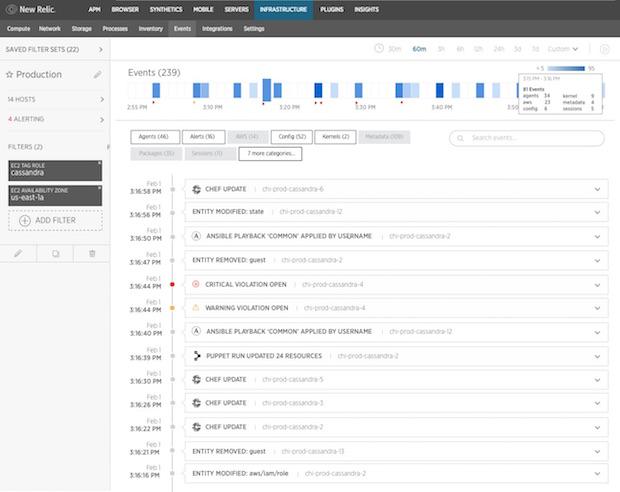
Live-state event feed with complete change history
The key to more effective and efficient troubleshooting is to have all teams on the same page. With New Relic Infrastructure, you gain unprecedented visibility into the performance of your dynamic infrastructure so you can effectively manage the increased rates of change being made to it.
- Accurate, real-time inventory of all hosts and instances across your entire infrastructure
- Powerful infrastructure-wide search to help you identify vulnerable packages in seconds
- Tag-driven alerting and dashboarding for all your dynamic resources

Built with AWS in mind
New Relic Infrastructure is tightly integrated with AWS EC2, allowing for an accurate, real-time view of your EC2 ecosystem. New Relic offers 360-degree visibility for your apps, your server infrastructure, and your Docker containers—all in one place.
- Native support for AWS tags and metadata
- Dissect key AWS attributes—role, tier, AZ, datacenter, or any custom EC2 tag
- Alerts that auto-scale along with your instances

Easily monitor popular AWS services
Both New Relic Infrastructure Essentials and Pro ship with native support for Amazon EC2 and Docker. New Relic Infrastructure Pro offers expanded native monitoring for popular AWS services including:
- Amazon CloudFront
- Amazon DynamoDB
- Amazon EBS
- AWS Route 53
- AWS ElastiCache
- AWS Elastic Load Balancing
- AWS Elasticsearch
- AWS IAM
- Amazon Kinesis
- AWS Kinesis Firehose
- Amazon SNS
- Amazon RDS
- Amazon ECR
- Amazon SQS
- Amazon VPC
- Amazon ECS
These integrations make it easier to view and account for your AWS usage—whether that means analyzing your AWS spend, preparing for a quarterly budget review or forecast, assessing the impact of scaling up your service, or looking at spikes and dips in usage and data flow so you can fine tune your AWS infrastructure and application management.
Free access to New Relic. Forever.
Monitor your stack for free with full platform access and 100GB of ingest per month. No credit card required.
이 블로그에 표현된 견해는 저자의 견해이며 반드시 New Relic의 견해를 반영하는 것은 아닙니다. 저자가 제공하는 모든 솔루션은 환경에 따라 다르며 New Relic에서 제공하는 상용 솔루션이나 지원의 일부가 아닙니다. 이 블로그 게시물과 관련된 질문 및 지원이 필요한 경우 Explorers Hub(discuss.newrelic.com)에서만 참여하십시오. 이 블로그에는 타사 사이트의 콘텐츠에 대한 링크가 포함될 수 있습니다. 이러한 링크를 제공함으로써 New Relic은 해당 사이트에서 사용할 수 있는 정보, 보기 또는 제품을 채택, 보증, 승인 또는 보증하지 않습니다.


